
Irresistible momentum?

We call our regular Apollo based commentary “The Weather report”. The analogies that we can make with the multiple elements of Value, Momentum and Uncertainty impacting markets in a continuous way chimes nicely with the idea of Currents, Tides and Winds, all impacting the navigation of the high seas. Whatever the nature of the vessel concerned or the skills, experience and capabilities of the crew, the Maritime Weather Report is an essential part of the information system that is required and so the Market Weather Report is designed to perform a similar, essential function.
June arrives on the back of a solid Q1 earnings season for US stocks (the best since 2021) and an ongoing sense of positive momentum towards technology (and AI) driving a belief in the continuation of this rally. The scepticism that we continue to monitor in regard to AI as it shifts from being a simple (must have) narrative to a more tangible earnings and revenue story does not seem to have dimmed the enthusiasm of April into May and, with the geopolitical rollercoaster seemingly allowing the market to “normalise” the potential economic impact without stress or further anxiety: the VIX has returned to January levels (below 16) and the party appears to be continuing into mid-year largely unabated.
It does seem remarkable that what seemed to be a potential crisis three months ago – the onset of conflict in the Middle East and oil prices surging beyond $100/bl – is now regarded as an irritant to be resolved before economic recovery can resume. Even though the political backdrop remains febrile, the flow of capital into the financial markets continues (particularly from US retail it would seem) and, as the driver of returns appears to spread away from the Mag-7 and towards broader areas beyond Technology such as transportation, communication, and energy, the “momentum trade” for the market appears to be broadening.
Against this backdrop we are about to see the launch of SpaceX onto the market, with the largest IPO in modern stock market history due to arrive in less than two weeks’ time. With an estimated total valuation of up to $2 trillion, the amount of vested interest in this issue succeeding is enormous and the hype cycle surrounding it is unprecedented. Even though the implication is that the opportunity is all about “robots and rockets” the reality is that the SpaceX IPO is, for the most part, an AI Enterprise story according to the documentation (and may explain why the AI hype cycle is persisting). Moreover, this is an IPO that Wall Street needs to succeed. Retail will be playing a big part in this with up to 30% participation predicted – as will the index trackers and passive funds going forward. On the downside, the liquidity impact for the whole market is likely to be a major point of concern and, if external risk factors reappear between the estimated listing day (June 12th) and the July 4th weekend, the risk of a broader market failure is not to be underestimated. Perhaps the need for success will lead to compromise elsewhere by Washington, who knows? Either way, the capability for this market to move into the summer period with the current levels of (low) volatility and positive momentum are going to be heavily influenced by how this evolves.
Review of Performance – under the surface
In taking our normal look at some of the recent performances of the main market indices through the lens of the Apollo strategy models (price performances are to index close values from 29 May 2026) we continue to build upon our thoughts over the last few months. As part of our Smart Alpha Evolution, we have added in the (total return) performance of two additional strategies – an extension strategy – a 130:30 version of the Global Large Cap Multi-Factor (long only) Strategy and a “Market neutral long/short” version of the Global Strategy. The benefit of these additional strategies is the ability to gain insight from the non-correlating nature of the long/short and the leveraged benefit of the extension strategy.
The 6-month returns in Table 1 take us back to the end of November whilst the 3-month number taking us back to the end of February – the point at which hostilities in the Gulf kicked off. We have also retained the 1-month return numbers that we added to table 1.
Table 1: Performance Report (price returns %)
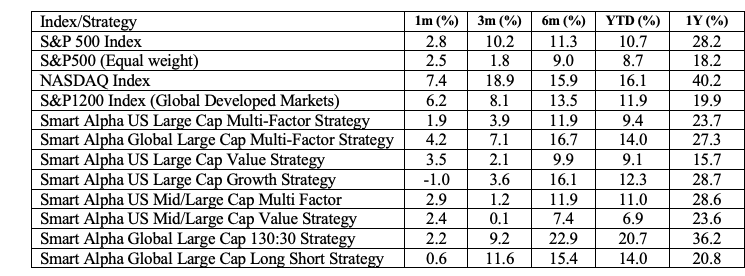
The “normalisation” that we noted last month after April’s rebound/ recovery remained the message for May. The relatively low returns for the long/short and (leveraged) 130/30 strategy in May reflect the negative returns to the short leg of both portfolios iover the course of the month but the whole point of the non-correlating long/short approach is captured by the six-month and one-year returns. Even outside of this hedged framework, many investors in the broader market are heading to mid-year with the kind of double-digit gains that imply equities are, once again, more than delivering what they are supposed to in terms of returns.
Whilst there are still likely to be a large number of portfolio managers who, having reduced exposure in March remain underweight and find themselves chasing returns, for those who have been able to maintain exposure throughout, the temptation to lock in some of the profits seen in the tech sector in particular, is bound to increase between now and the start of July. Yet with the Mag-7 doing relatively little (+7.7%) but the semiconductor sub sector in particular continuing to perform exponentially (+97.5%) on a year-to-date (YTD) basis (note that the sector has been very heavily traded by US retail), it is not clear where relative profit taking might take place (if at all?) before we move to quarter end and the summer slowdown.
Chart 1 – US Semiconductors
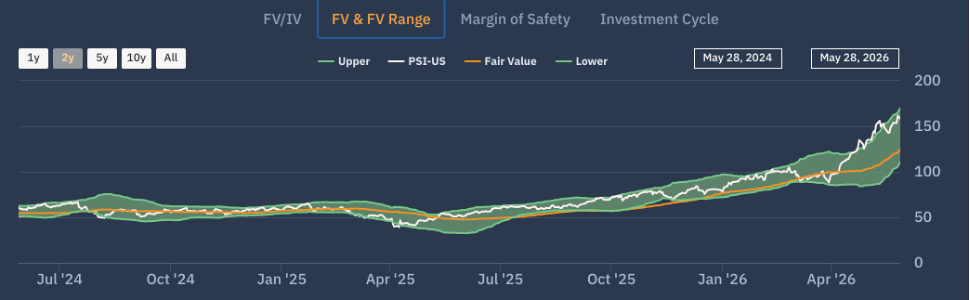
Chart 1 shows the US semiconductor sector on the Apollo Edge platform, with the Apollo Fair Value and Fair Value trading range over the last two years. The (+97.5%) price rally referenced YTD can be seen alongside a smaller – but still impressive increase in sector FV of (+65%) over the period. Apollo’s investment cycle analytics model suggests that the sector moved from a re-rating period into a clear growth phase from mid-March. The rally from that point – confirming the lower bound of the Apollo FV range at the end of March to then run at the upper boundary over late April and May, shows that sentiment is persistently strong. In the same way that the “relatively” lacklustre Mag 7 performance doesn’t argue for cutting exposure so much as broadening it (with a degree of relief) away from the mega caps, the fact that the AI story is being so heavily accessed via the hardware side of things is not a reason to rush to profit take against such a strong demand background. If SpaceX struggles at launch, then the sector is at risk of a retracement but if it succeeds? It’s hard to see the semiconductor sector being a source of rotational momentum within the broader market.
Broadening out further
If anything, it looks as if the general broadening trend of recent months may have further to go. Given how narrow the market had become by late 2025, the best datapoint to monitor is probably the six-month % return figure. The sell-off and recovery phase of March/April has now washed through so that the (+11.3%) 6m figure for the S&P500 (the equal weight version is up (9% over the same period) is more reflective of the current level of market risk and return. Global markets have provided a similar return (+13.5%) with the NASDAQ (+15.9%).
Alongside these we can see the selection of Smart Alpha strategies – including the additional ones referred to above – that we run (and publish – see https://www.libra-is.com/strategies ) reflected here. On that 6-month basis, there is still clear water between the Smart Alpha Multi-Factor strategies and their respective benchmarks, but we note how both the Leveraged (130;30) Global Strategy and the Long/Short Global were able to capture the benefits of non-correlation in the March selloff/April rebound period. For the Long/Short in particular, a (+3.7%) performance in March followed by a (+6.8%) increase in April is a reminder of precisely why a properly integrated long/short Equity strategy is an invaluable component of an overall portfolio. The fact that this returned to being an essentially flat performance in May underscores this fact.
The Growth/Value trade-off may now be unwinding but it can still be seen in the data for the various US Value and Growth strategies where a strong rebound in Growth stories has left Value lagging. We are able to generate these distinct single- style strategies by virtue of the fact that we categorise all the stocks under coverage by “style factor” based upon our own, fundamentally derived classifications (Value, Growth, Quality, Junk etc.) using the Apollo model for expected returns. This allows us to dive a little further into the drivers of returns. Outside of this we have the multi-Factor strategies, where we seek to maintain a “Factor neutral” approach at each rebalance so that we are not taking style bets. At the headline level, the Global 1200 Multifactor strategy is up (+17%) over the last six months, whilst the US Large Cap Multifactor (+12%) – suggesting that a “spreading of Factor risk” across the Long only groupings of Value, Deep Value Quality and Growth has paid off in terms of diversification.
Risk (and returns) by Factor
In terms of the factor drivers that we can see in Table 2, the differentiated drivers of the Global Multi–factor portfolio from the sub-portfolios over the last six-months has been from Quality (+21%) and Growth (+20%) whilst Deep Value (+14.2%) and Value (+7.3%) have lagged. The two months of April and May provided a spectacular recovery for Deep Value in particular with, as we suggested last month, neither Growth nor Quality being able to provide excess returns during May. Our regular 2-month rebalance (22 April) took us back to equal weighted exposures at a factor level across all of the multi factor strategies so our “Sprint” performance highlights just how much “Deep Value” has rallied since then.
Table 2: Global Factors
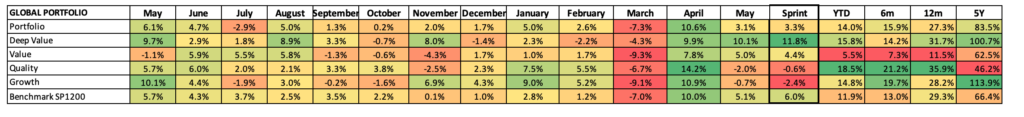
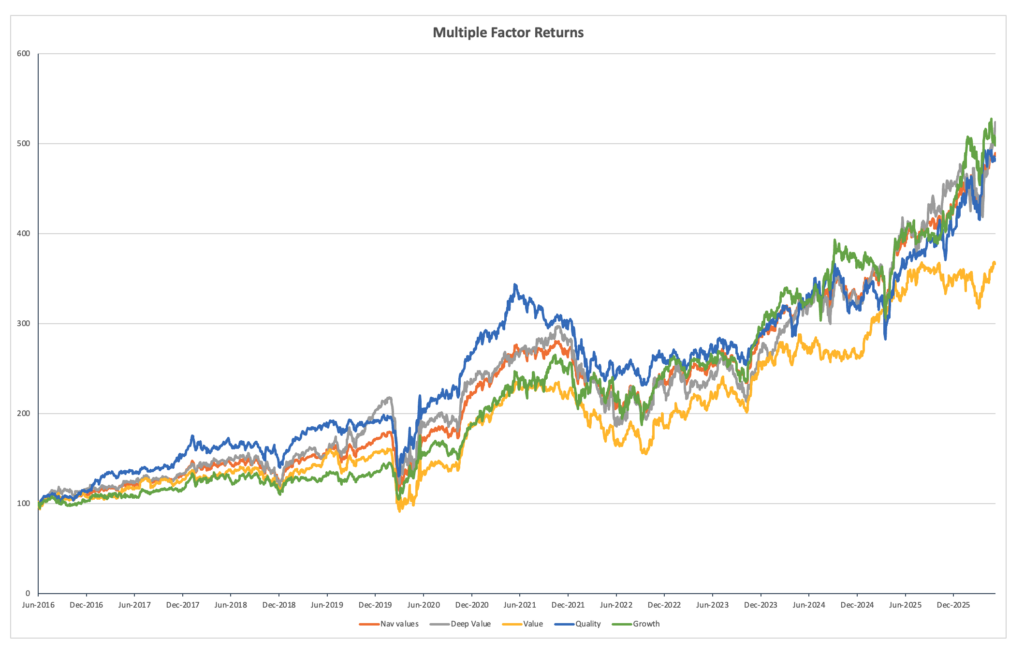
Chart 2 shows the longer-term trends of factor returns and illustrates this point further with Deep value (greyline) rising sharply in recent months. Quality – the dominant (blue line) from 2016 onwards remains aligned with both the total portfolio (orange) and clearly ahead of value (yellow) over the total period with Growth (green) a compounding winner over longer horizons and, one of the dominating factors of late. Meanwhile, the relative under-performance of Value is thrown into sharp relief in the chart, suggesting that broader risk appetites have already been muted in recent times and that style factors are perhaps playing second fiddle to payoffs when it comes to compounding returns.
Chart 2: Compounding returns
Weather Forecast – nothing lasts forever
In the absence of clear resolutions in either the Gulf or in Ukraine, the political and economic calendars are continuing to build new pressures for the second half of the year. Even after the recent visit to China, longer term tensions between the US and China appear unresolved whilst the risks to Cuba, the escalating European/Russian war of words, pressures on global supply chains as well as issues over de-dollarisation, The UAE leaving OPEC, pressures building within the BRICS+ countries ahead of Elections in Brazil in October and recent elections in Columbia are amongst a plethora of potential flashpoints and headline grabbing events to contend with.
By contrast, from a market internals point of view things are certainly calmer. The de-risking seen in March has unwound and, as we noted above, volatility has compressed back to the levels of early 2026. General flows have improved strongly and “positioning” along with it. The suggestion that the market is “broadening-out ” has some basis in fact, but it does appear to still depend on a relatively narrow cohort of outperforming stocks albeit with a few sectors such as consumer discretionary and healthcare now seeing positive sentiment.
Chart 3: The S&P bellwether
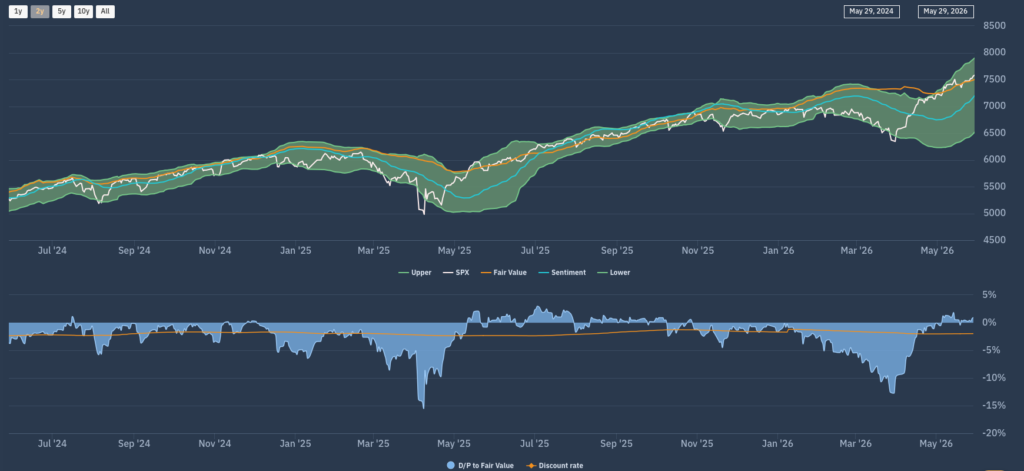
Looking at the Apollo market chart for the (market Cap weighted) S&P500 (Chart 3) we see a market that has traversed from (a break back-up through) the lower boundary of the Fair Value range to the top of the FV range over the course of a month and has now aligned with the rising FV trend. This is quite a turn-around and the trend in Sentiment (blue line) has now realigned upwards, suggesting a rising level of support for this trend. As we noted last month, this is very similar in style and degree to the post April 9th 2025 rally and suggests that (absent an external shock) this rally could certainly be sustained with a “fair wind” well into the summer.
Moving down a level, we can look at the sector level dynamics now emerging using Chart 4 – the Apollo S&P500 sector beta heat map to do so. This shows the relative sector rankings in terms of rolling 1-month returns across the main US S&P500 market sectors, ranked by relative market beta from high beta (cyclical sectors) down to low Beta (defensive sectors).
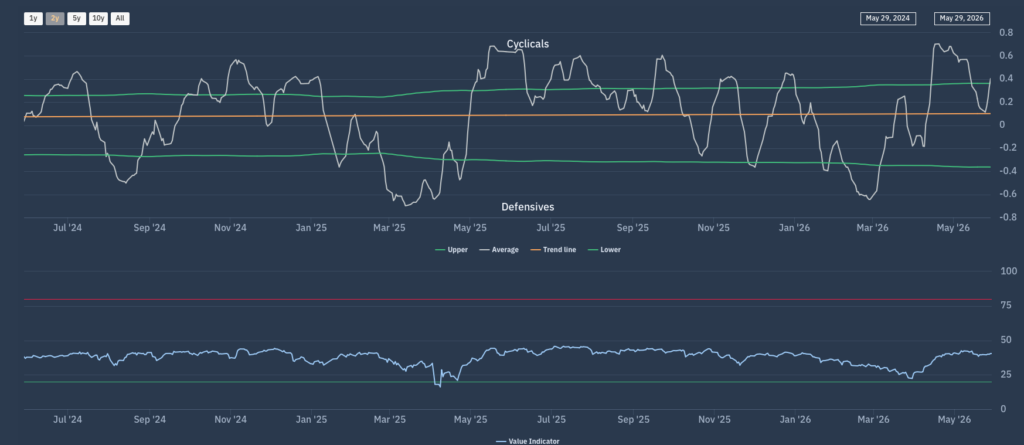
The total reversal we saw in April towards unequivocally positive performances across the higher beta cyclicals continued into May. Our “Macro indicator” shown on the Net beta chart (Chart 5) once again reinforces the similarity to April 2025 where we can observe the net exposure bias between defensives and cyclicals shifting from where, having moved back to new 10-year highs at the end of April 2026, we remain at elevated levels as we go into June.
Chart 4: Apollo S&P500 Sector Heatmap
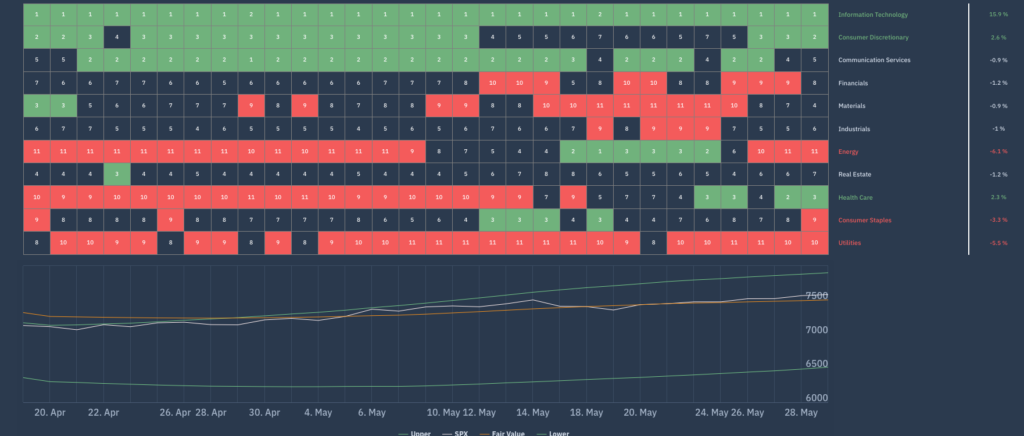
Chart 5: Apollo S&P500 Net Beta Chart
Forecasts and conclusions
Even though it seems like the first five months of 2026 have been mostly driven by external events, as we move into June it seems likely that the internals of the market will be taking hold. The SpaceX IPO is going to be central to this and alongside it will be the role of internal market flows. This is the core of the current “momentum trade” that is garnering so much market attention right now. In their latest review, Citadel Securities highlight how dominant they consider the retail trading market in the US to now be in terms of price setting, with trading volumes now ahead of the peak levels seen in the 2021 meme stock trading era. Options premium trading by retail is also exploding higher but is no longer about memes but rather mimicking institutional concentrated exposures to high quality names and sectors such as Semiconductors where the gross options premium across the sector is approximately 5x the monthly average according to Citadel Securities. If they are correct and the pain trade for those seeking to catch up is to the upside, then the role that the SpaceX IPO may have should not be overlooked. With retail being targeted for an unprecedentedly large component of this, we can expect the wall of commentary around it to be overwhelming, but if the current momentum trade is going to be disrupted, any weakness around the issue could be highly risky. This suggests that even if they seem quiet for now, Geo-political tensions are only just below the surface. And the one thing we all know about momentum is that it seems to go on forever – until it suddenly just doesn’t.