
Absolute Kelvin

Weather Report June 2026 – Absolute Kelvin
.
We call our regular Apollo based commentary “The Weather report”. The analogies that we can make with the multiple elements of Value, Momentum and Uncertainty impacting markets in a continuous way chimes nicely with the idea of Currents, Tides and Winds, all impacting the navigation of the high seas. Whatever the nature of the vessel concerned or the skills, experience and capabilities of the crew, the Maritime Weather Report is an essential part of the information system that is required and so the Market Weather Report is designed to perform a similar, essential function.
There’s just an awful lot going on in markets right now. Having just navigated the combination of a new Fed Chairman being installed, a record breaking quadruple witching options expiry with more than $8 trillion of options exposure rolling off, financial quarter end, financial half year end, the stellar launch (and equally rapid re-entry) of the IPO of SpaceX and its associated bond issue followed shortly by suggestions of a likely delay to an Open AI IPO, SpaceX’s entry into the Russell 1000 (and set to join the NASDAQ 100 on July 7th). The narrative around AI infrastructure investment has flipped from being a driver of growth to a constraint upon it, Brent oil prices are now down ~50% since March highs and gold has fallen by 30% from its January highs and Bitcoin is now more than 50% below last October levels. And all that is before we roll on into the 4th July weekend and 250 year celebrations in the US or focus in on the still volatile situation in the middle East.
As we noted last month, the latter continues to operate as something of an irritant to markets as opposed to a risk. The headline declines in Oil, Bitcoin and Gold all reflect the perception of extended macro risks easing over the course of the last few months and with July being traditionally a strong performing month for US markets, the “buy the dip” mindset of the US retail sector in particular looks well set. Record levels of corporate Buybacks in H1 will also help to underpin the overall markets – even as the equal weighted S&P500 hits an all-time high, outflows for Tech ETFs hit record levels and the Mag-7 slide.
Kelvin waves
When I started writing the monthly Weather Report, I deliberately used the analogies of maritime waves, tides, and currents to the multiple elements of value, momentum and uncertainty (or predictability) continuously impacting on markets. The fact that much of what is now central to financial mathematics emerged out of the mid 19th century work on the theory of water waves and fluid dynamics is certainly an influence in this selection but, like all analogies it can run the risk of collapse when stretched too far. Aware of that risk – I’m going to extend it anyway, to the concept of Kelvin waves. These waves (named after Lord Kelvin) form a classic “V wake” from an object such as a boat moving at a steady rate across deep water. These are waves created by the interaction of an object (or agent) with an existing (deep-water) surface, with both transverse waves along the direction of motion alongside wakes that have a divergent pattern with a constant angle (see the picture above) and cusps where these two wave forms interact.
There are also another class of Kelvin waves – geophysical or planetary waves – deep in the ocean that rely on the rotation of the earth and the boundaries of the equator and natural coastlines. These take the form of long running, invariant waves that retain their shape over thousands of miles, and the massive swell of warm pacific equatorial waters that move eastwards across the pacific and accumulate off the western coast of central and south America are the precursor to an El Niño which develops as multiple Kelvin waves appear over the course of several months.
Hopefully this makes the additional (Kelvin) wave analogy to financial markets clear. Referring to “Kelvin waves” might seem opaque at first sight to those outside of Maritime engineering or Nasa’s Jet Propulsion Laboratory, but external waves that result from a boat or object moving across a surface (a transient but recognisable and observable wave form) or more hidden, deep long-term water flows that ultimately lead to more system wide, climatic change events such as El Niño are far easier to grasp.
A combination of both top level (surface) waves created by agents interacting with the underlying deep water, and long term, deep-running, invariant flows that are independent of surface conditions but ultimately accumulate against their geological boundaries are parallels to the impact events described above: the IPO of Space X being an example of the former whilst the emergence of AI as a driver of long term investment capital and the underlying global energy demands that are seeing shifting patterns of supply and demand refelcting the latter.
Review of Performance – under the surface
In taking our normal look at some of the recent performances of the main market indices through the lens of the Apollo strategy models (price performances are to index close values from 30 June 2026) we not only build upon the observations of the last few months but also take insight for looking into the second half.
The 6-month returns in Table 1 take us back to the end of 2025 whilst the 3-month number taking us back to the end of March and the low point of the investor year after a month of hostilities in the Gulf. We have also retained the 1-month return numbers that we added to table 1.
Table 1: Performance Report (price returns %)
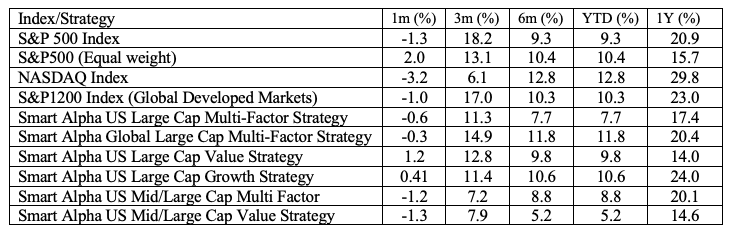
We can see from this, that the one-month and three-month returns capture a far more cautious move into half year end after the volatility of March and April. It’s almost as if the SpaceX IPO put a momentum stop on the post March rally. Most of the YTD figures are also in line with each other now – around 10% and a level of returns worth preserving if possible as we enter the summer period. When combined with all of “the other stuff going on” it confirms a sense of pause is building. Remember, too, that this time last year the market was only barely up on the year after the April 2 “Liberation Day” traumas. As we noted at the time, by the start of July 2025, most indices had only just made it back into positive YTD return territory ( the Apollo Strategies had done significantly better – returning to positive territory by mid-April 2025). The need to remain engaged on the recovery trend was a far stronger incentive then than now.
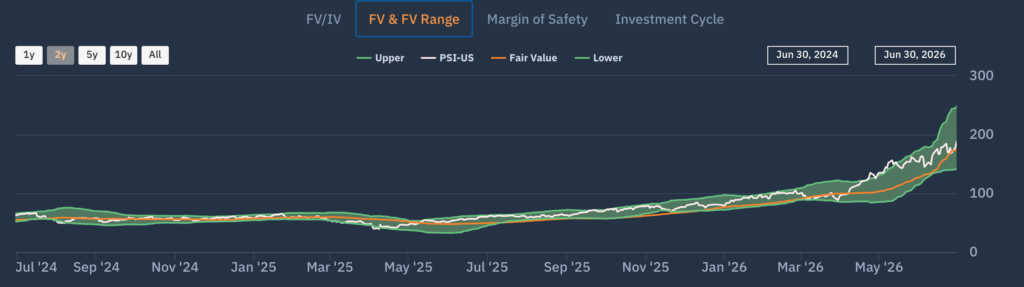
What has remained an investment focus, however, is the persistence of semiconductors as a theme – the hardware of the AI story. This has been especially so for the retail investor sector who clearly see the technology/ AI story panning out beyond the M7 ( down nearly 8% on an equal weight basis in June and flat YTD). As we can see in Chart 1, the risk appetite for the sector has been rewarded since mid-June by something of a SpaceX halo effect – with sector level FV (orange line) rising strongly as stocks continue to be rerated on the back of a strong reporting season. Wary of the liquidity impact of SpaceX and other potential IPOs coming later in the year, overall tech related ETFs saw very large outflows in June – particularly across those ETFs where leverage could/was being applied. With a move to include SpaceX in the Russell 1000 already having taken place and with a similar NASDAQ move due next week, there are clearly going to be passive flows in support of the stock but with a massive overhang of potential SpaceX insider lockups coming onto the market by September we would expect SpaceX to be reflecting its own “Kelvin waves” across the surface for a while yet and would not look to see it as an effective lodestar for market sentiment for some months yet.
Those other “Kelvin Waves”, however – the deeper water ones of AI capex and Geopolitical risk – are not to be ignored. Like their El Niño real world counterparts their existence is not denied nor their potential (negative impact) ignored: it is just that – as we noted last month – their risk impact is assumed to be factored in and therefore “priced in”.
Chart 1 – US Semiconductors
Equal weight but not equal risk
Beyond this, the other feature that the market has focused in on is the benefit to the equal weighted S&P500 that the weakness of the M7 has had so far this year. As a reminder of the “active” bet on the mega caps that the “passive S&P500 investor has been taking this year, the 138% rally of the US Semiconductor stocks so far this year (as represented by the PSI ETF) is a further reminder of the importance of both stock selection and position sizing in terms of portfolio returns.
Alongside these we can see the selection of Smart Alpha strategies that we run (and publish – see https://www.libra-is.com/strategies ) reflected here. To a large extent these mirror the overall market patterns of returns – not a surprise really given the “V shaped” performance of the first half although weak performance of the mid large cap value subsector remains an outlier. We are able to generate these distinct single- style strategies by virtue of the fact that we categorise all the stocks under coverage by “style factor” based upon our own, fundamentally derived classifications (Value, Growth, Quality, Junk etc.) using the Apollo model for expected returns. This allows us to dive a little further into the drivers of returns. Outside of this we have the multi-Factor strategies, where we seek to maintain a “Factor neutral” approach at each rebalance so that we are not taking style bets. At the headline level, the Global 1200 Multifactor strategy is up (+12%) over the last six months, whilst the US Large Cap Multifactor (+8%) compared to (+11%) for large cap growth suggests that it is the mid cap value sector that is dragging on performance
.
Risk (and returns) by Factor
In terms of the factor drivers that we can see in Table 2, the differentiated drivers of the Global Multi–factor portfolio from the sub-portfolios over the last six-months has been from Deep Value (+25.7%), Quality (+11.6%) and Growth (+7.5%) whilst Value (+2.5%) has lagged. The two months of April and May provided a spectacular recovery for Deep value but June has been a disappointment for growth or quality. Our regular 2-month rebalance (June 17th) took us back to equal weighted exposures at a factor level across all of the multi factor strategies so our “Sprint” performance highlights how much “Deep Value” has rallied since then.
Table 2: Global Factors
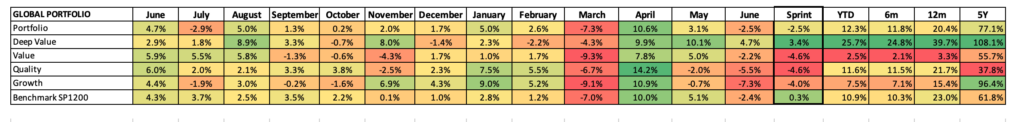
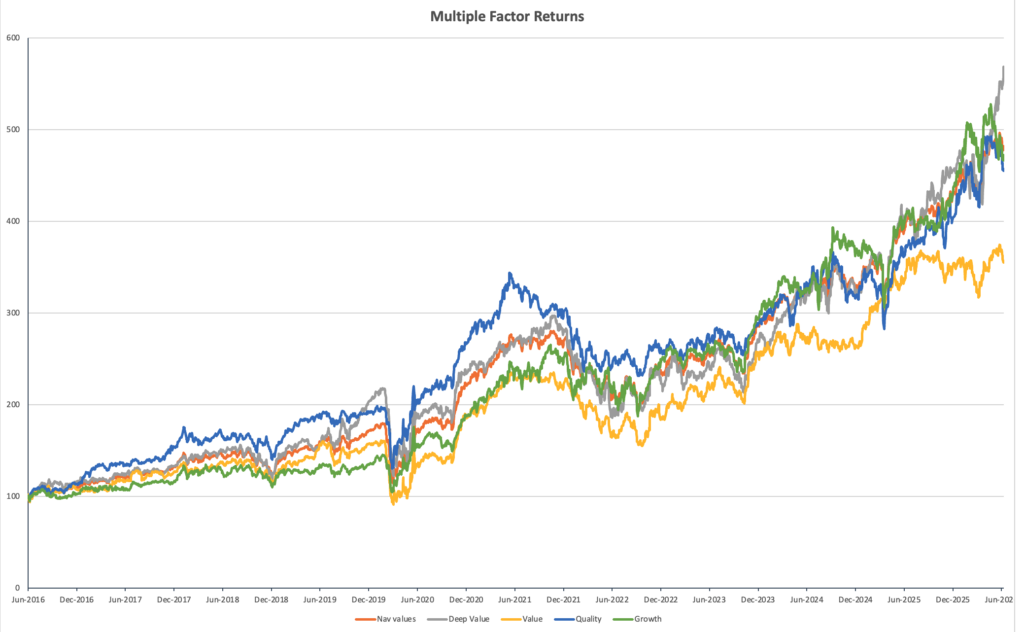
Chart 2 shows the longer-term trends of factor returns and illustrates this point further with Deep value (greyline) rising sharply in recent months. Deep Value’s outperformance (grey line) is clear, whilst the relative under-performance of Value (yellow) is thrown into sharp relief in the chart, suggesting that broader risk appetites have already been muted in recent times and that style factors are perhaps playing second fiddle to payoffs when it comes to compounding returns.
Chart 2: Compounding returns
Weather Forecast – summer comes
As we noted last month, conflicts in the Gulf and in Ukraine remain unresolved geopolitical issues– albeit with the former now in a far more comfortable – if fragile- situation than previously. We have a new Fed Chairman, and the political and economic calendars are continuing to build new pressures for the second half of the year as the prospects of the US midterm elections and declining political support for many of the political leaderships in the west cause bond markets a level of unease.
Market internals are reflecting this to a greater or lesser degree. Volatility levels in the S&P 500 remain low, but those in the NASDAQ have risen sharply over the course of the month with stock level volatility rising sharply on news flow as some of the stellar individual stock moves of the first half give way to profit taking and leverage de-risking
Chart 3: The S&P bellwether
Looking at the Apollo market chart for the (market Cap weighted) S&P500 (Chart 3)
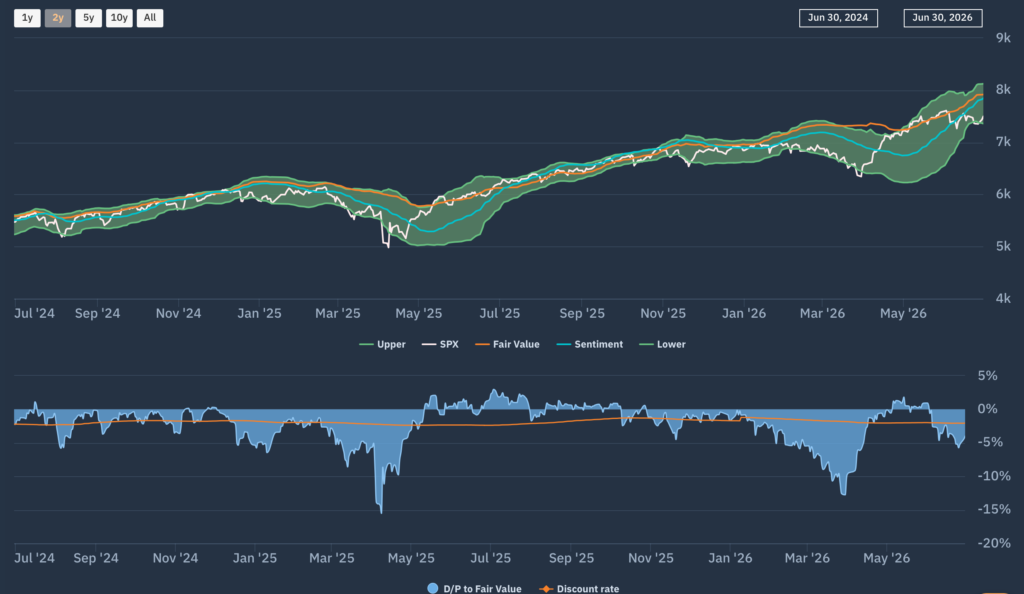
we see how in May, the market traversed from (a break back-up through) the lower boundary of the Fair Value range to the top of the FV range to align with the rising FV trend but that has subsequently traded sideways to, once again, stabilise at the lower boundary. Sentiment (blue line) remains upward sloping , suggesting a rising level of support for this trend but the momentum has clearly dropped out of the headline market. That may not be as much of a concern as it might seem – as we saw last year, quieter markets against positive valuation trends tend to provide lower risk environments for markets to move more steadily upward.
Moving down a level, we can look at the sector level dynamics that are emerging using Chart 4 – the Apollo S&P500 sector beta heat map to do so. This shows the relative sector rankings in terms of rolling 1-month returns across the main US S&P500 market sectors, ranked by relative market beta from high beta (cyclical sectors) down to low Beta (defensive sectors).
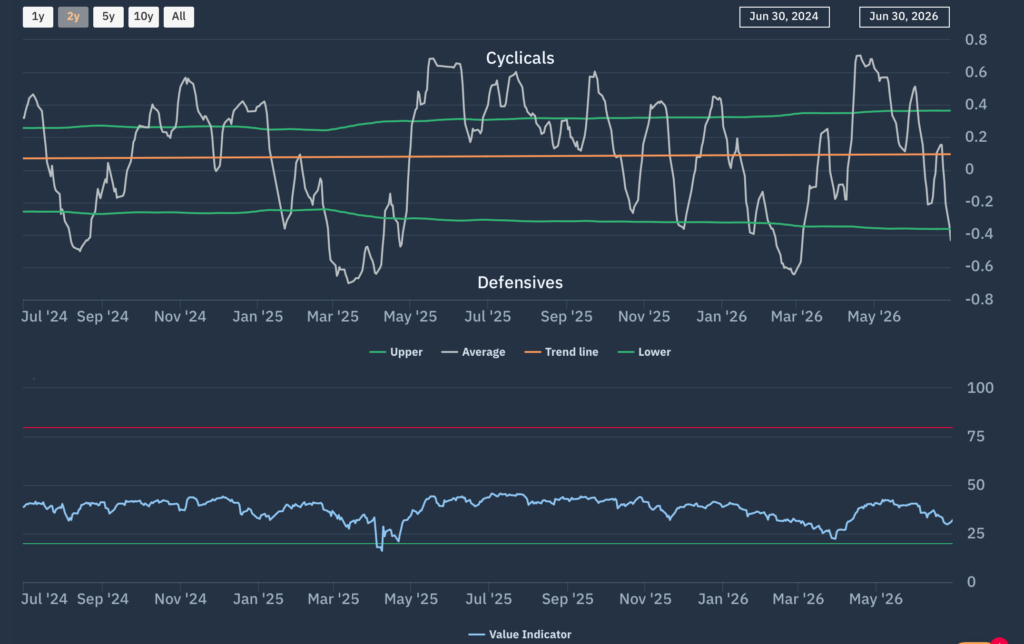
We see how, from mid-month, the flows out of higher beta sectors has shifted risk appetite lower Our “Macro indicator” shown on the Net beta chart (Chart 5) captures this reversal as the net exposure bias between defensives and cyclicals shifting from where, having moved back to new 10-year highs at the end of April 2026, have returned to relative (but not extreme) lows once more.
Chart 4: Apollo S&P500 Sector Heatmap
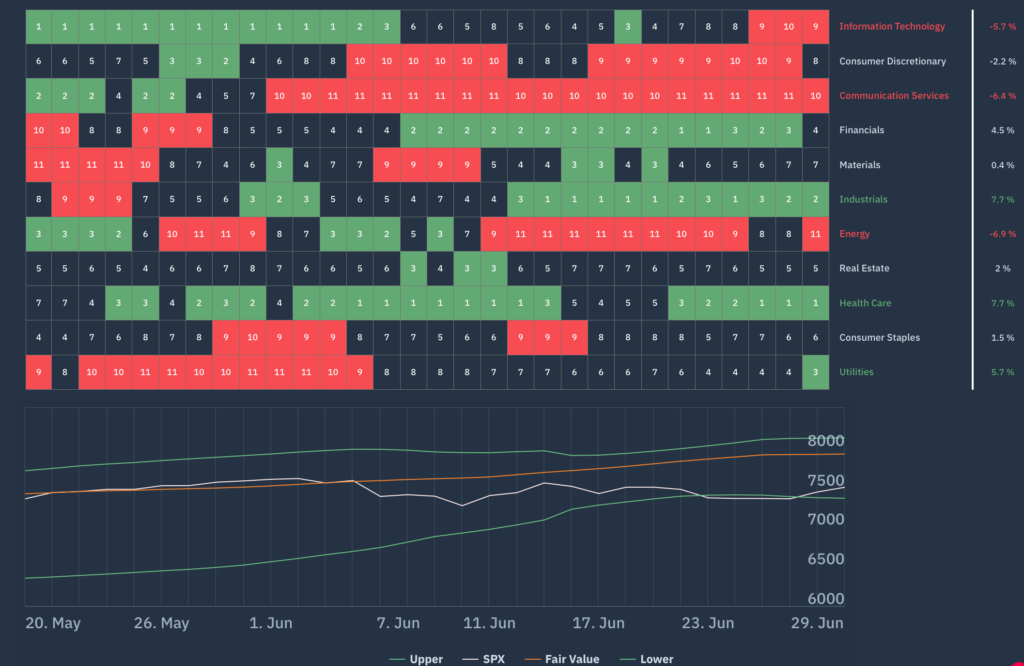
Chart 5: Apollo S&P500 Net Beta Chart
Forecasts and conclusions
Our newly introduced Kelvin wave analogy forms the basis of our forecast framework for the summer ahead. Looking back at H1, it is hard to see how much of the price action of March and April – and the follow through into May and early June makes sense in the context of traditional risk metrics. At the surface level, the impact Kelvin “V waves” from market actors relating to share buybacks (over $900bn YTD in the US), the SpaceX IPO, President Trump’s Truth Social postings, actual overnight events from the Gulf or Ukraine, – all add an information set to price action, positioning, liquidity and trading strategies that are not captured (or capturable) by such risk models. But what we also note is how much deeper this evolving information space now goes, and how we need to be able to recognise how both Kelvin wave forms are impacting on markets as a whole.
In March, concerns over global energy supply chains and the very real risk of military escalation led risk models to force liquidations but, in doing so, it is perhaps the revealing of – and focus upon – the underlying structural drivers of the global economy that is the most important information set to have emerged from that period. The long term “Kelvin waves” of fixed capital flows towards the dynamic growth story of technology and innovation, the recognition that real world fixed capital investment as opposed to financialisation is going to be a driver of returns (or not), the longer term impact on the global supply chains of raw and derived materials – rare earths, energy, computer chips, space and satellite technology – are all evolving, multi-year investment themes that are now crystalising the “meme and vibe” mindset of the last year or so into proper long term risk and reward decisions. It is not a coincidence that the fastest emerging investor subgroup – US retail – is acting in line with this new approach. Volumes are at new highs, but flows are taking on an increasingly sophisticated investment style that is a far cry from the days of YOLO investing (You Only Live Once), WallStreetBets, and short-squeezing GameStop. AI hype may persist but at the heart of this is an emerging level of investment information that is leading to those investors making more risk aware, persistent investment decisions.
Does this suggest that we are about to move into a world of less noise and more long-term investment flows? Probably not. But it does suggest that there might be more considered support for the “buy the dip” mentality than in the past and it might also give pause to those who think that US retail will remain the liquidity provider for whatever the PE and VC crowd think they can throw at it. Think of it as less about risk taking and more about risk management.