
Mountains and ANThills

We call our regular Apollo based commentary “The Weather Report”. The analogies that we can make with the multiple elements of Value, Momentum and Uncertainty impacting markets in a continuous way chimes nicely with the idea of Currents, Tides and Winds, all impacting the navigation of the high seas. Whatever the nature of the vessel concerned or the skills, experience and capabilities of the crew, the Maritime Weather Report is an essential part of the information system that is required and so the Market Weather Report is designed to perform a similar, essential function.
The road to (Orod)ruin
The pattern of the weather report over recent months has been designed to be somewhat “Reithian” – based on Lord Reith’s famous triad view of the BBC’s public service mission “to inform, educate, and entertain. And the use of nautical analogies, discussions of wave dynamics, and references to yacht racing are all part of this. Hopefully, the framing of markets in a language of competition amongst peers who are (collectively) facing the same uncertainties in changing conditions, and where experience, skill and judgement mark out the winners from the losers can add insight along these Reithian lines with maps of the southern Oceans and discussions of the “blue marble” thrown in for entertainment value.
However, there are some months when events – both recent and shortly forthcoming – shift the need for such a framework to the margins. With the US mid-terms upon us, the war drums over what might or might not happen to Pickaxe Mountain in their wake has created a potential singularity far darker and more serious than anything speculated about by the AI industry. Indeed, given the slightly obsessive manner in which that particular industry seems to conflate its self-image with that of the imaginary world of J.R.R Tolkien, the parallels between events in the middle East and the issues in the AI industry are probably worth noting. The symbolism of “Mount Doom” (or Orodruin as Tolkien named it in the books) has already been translated across in some circles. Pickaxe Mountain – a literal translation from the Persian – being referred to as “Mount Doom” is designed to evoke a response. We just have to hope that the response does not lead to catastrophic one.
The ANThill
Meanwhile, the slow-boiling of the circular-finance frog underpinning the US “AI Bubble” (as it is now widely being called) that is coming to a head across not only the individual companies reporting in their latest quarterly reporting rounds but also across markets – is another such event. More immediately, the suggestion at the end of last week that any forthcoming credit issuance from the company of the moment – Anthropic – might not make investment grade is incredibly significant. A planned IPO for a company whose massive, uncancellable capital commitments would not be able to be credibly funded through anything other than junk financing or ongoing equity issuance is the kind of reality check that would normally halt an issue in its tracks. Yet with the release of their Q3 data today – updating some of the context of the provisional S1 release of last week where attention was mostly placed in the data that wasn’t there – expectations remain that this IPO will happen – possibly this side of Thanksgiving.
Realism or Nihilism?
As October starts, this is what the market must contend with. The Old Farmer’s Almanac has it (OK, quick Reithian interjection here) that the sight of unusually high Anthills in July was a portent for a severe hard winter. Now, as Anthropic seeks to come to market with the proposed NASDAQ stock ticker ANT, it could be said that the unrelenting wall of pro IPO messaging coming from the media and what are often referred to as “AI boosters” in the industry is pushing for investors to ignore everything but the need to get this issue away successfully. Like it or not, beyond the nuclear singularity cited above, the next month is only about the ANT issue – and the success or failure of it could well set the tone for the whole of 2027.
That there is a requirement for this issue to be done is not in doubt. Potential credit ratings aside, the need for a company of this size to have a “first loss” equity tranche is simply a hard-coded capital markets requirement. Reservations over the company’s reported numbers or the manner in which the SpaceX IPO in June was handled are righty raising a whole set of checks and queries from the financial press over the manner of any ANT launch, but it is doubtful whether the retail investor will gain any more protection than they did in the early summer from the market operators. Quite remarkably, post IPO management control remains with the existing founders – even if they have completely divested from ownership in the company. Under such conditions, the likelihood of ANT repeatedly returning to the Equity market for capital – effectively becoming an implicit ATM operator – should be a reason for caution amongst those who might want to see significant capital appreciation in their 401K’s. We shall see.
Review of Performance – hitting the wall
In taking our normal look at some of the recent performances of the main market indices through the lens of the Apollo strategy models (price performances are to index close values from 30 October 2026) we take the calendar quarterly update 3m% for Q3 and the YTD numbers as the baseline for review.
For context, the 6-month returns in Table 1 take us back to the end of April – levels that had followed the strongest month of the year by far, whilst the 3-month number taking us back to the end of July. The one-month numbers give sight to how markets have struggled to sustain the rally since the end of Q3 – with much of the reality being due to the sell-off at the end of the month.
Table 1: Performance Report (price returns %)
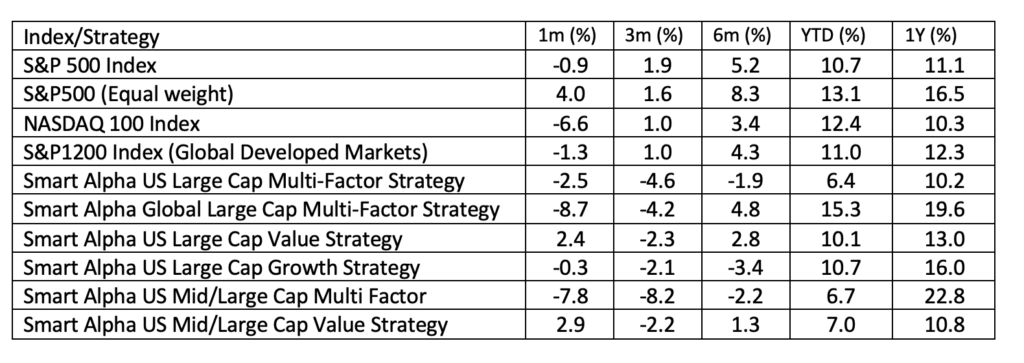
Even before the collapse in sentiment towards the hyper-scalers at the end of the month, we were already witnessing a significant reversal in the relative fortunes of the S&P500 equal weight index and the NASDAQ 100. The market narrative has been identifying the concentration risk factor of the Market Cap weighted S&P500 for some time now, but the comparison against the NASDAQ 100 is even more stark. It is probably no coincidence that the focus has moved on from not only the relative divergence of stock performance, but the actual reality of earnings, profitability and margin strength of the “493” versus the Mag-7 as evidenced by the C-Suite communications from the latest quarterly results season. The heavy sell off at month-end may have distorted things somewhat, but the 10.6% relative swing between the two indices during October suggests that a potential structural shift is underway.
With only two months to calendar year end – and less than a month from Thanksgiving (which acts as a de-facto year end for many funds), the YTD price returns for the NASDAQ 100 (+12.4%) the global S&P1200 index (+11%) and the main S&P500 US index (+10.7%) are still holding in at double digit levels but now lag that of the equal weight S&P500 (+13.1%). Locking in those returns will be very tempting for the latter – particularly given the likely liquidity impact of recent events but with the Polymarket odds of Anthropic bringing an IPO to market before year end being over 90%, it doesn’t feel if the market is in a mood to realign uncritically back to investing in optimistic, AI related intangible growth stories right now.
Alongside the benchmarks we can see the selection of Smart Alpha – that we run (and publish – see https://www.libra-is.com/strategies ) reflected here. On the one-month, six-month and YTD basis, the US Smart Alpha Multi-Factor strategy has taken a hit – arguably along the lines highlighted above. The Global Multi-Factor has also had a brutal reality check – down (-8.7%) in October but still remains ahead of the S&P 1200 benchmark on a YTD basis ((+15.5%) vs (+11%)). The negative impact from a rotation into growth related mid-caps is also evident from the under performance of the US Mid/large Cap multi strategy (-7.8%) which is now (+6.7%) YTD.
From a style perspective the Growth/Value trade-off can be seen in the data for the various US Value and Growth strategies that we run, and Value has resumed its relative outperformance – largely due to the collapse in demand for growth stories . We can generate these distinct single-style strategies by virtue of the fact that we categorise all the stocks under coverage by “style factor” based upon our own, fundamentally derived classifications (Value, Growth, Quality, Junk etc.) using the Apollo model for expected returns. This allows us to dive a little further into the drivers of returns.
Risk (and returns) by Factor
In terms of the factor drivers that we can see within a strategy (Table 2) the differentiated drivers of the Global Multi–factor portfolio from the sub-portfolios YTD saw exceptionally strong performance from Quality (+21%) over the quarter, (+33% YTD), and also from Growth (+20%) in Q3 (+29.5%) YTD) as earlier declines reversed – but October has returned with a vengeance. Growth was down (-13.5%) on the month – effectively re-aligning its YTD performances with those of the portfolio as a whole and more akin to those of Quality and Deep Value. As always, these Factor returns reflect our bespoke factor categories and stock selections – combined with the two-month rebalance that we undertake. Our last Rebalance was in mid- October and the performances of this latest sprint are also shown in the table.
Table 2: Global Factors

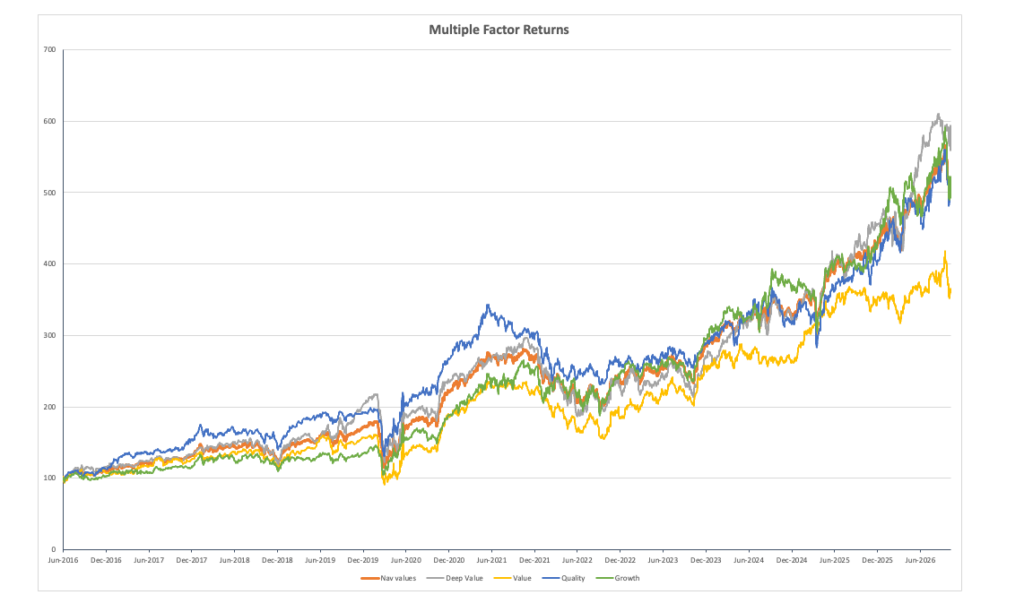
Chart 1 shows the longer-term trends of factor returns to illustrate these relative returns. Deep value (grey line) stands out at the top of the chart despite the retracement of the latest Sprint, with Quality – the (blue line) remaining aligned with both the total portfolio (orange) and, now with Growth (green). All the other baskets remain clearly ahead of value (yellow) over the total period. As we can see in Table 1, Growth – the clear, compounding winner over longer horizons has corrected to the greatest extent – it has now shown negative returns at the one-, three-, and six-month levels. Meanwhile, the relative under-performance of Value remains only too visible on the chart, reinforcing out thoughts that value stocks remain more of a risk management than a total return role in portfolios at present – albeit of limited benefit in the October month end rout.
Weather Forecast – “Risk-off”
As I noted last month, the focus upon quarterly returns and relative ranking is a major driver of much of the industry’s sense of self relative success, so this violent swing away from the recent winners will have left a lot of funds scrabbling for cover. Post-mortems of previous sharp selloffs have tended to reveal both planned and forced position adjustments take place under such conditions. It is not enough for everyone to simply understand the risk that exists in the market – it is a practical matter of how to manage the adjustment that might follow.
I started the September report by noting that “…a lot of the activity in the 4th quarter is going to be about calm heads and risk management of conditions. Holding onto performance thus far is obviously a major focus for active managers and it would seem that a fair degree of positioning has taken place to achieve this over the course of the last few weeks”. Well, it seems that the end of October highlighted how much more positioning was still required. The unforeseeable fall out from this will take time to feed through – watch out for some Halloween performance horror shows slipping out onto the media in the coming weeks – and with a “risk-off” position essentially a default near term, the noise around the Anthropic IPO will be taking place against a very different market “vibe” than the one surrounding SpaceX back in June.
This also applies to the range of macro realities the market is facing. The post mid-term elections period is going to prompt a degree of risk realignment in the run up to Thanksgiving as well as potential developments in both Ukraine and Iran as we look forward to 2027. Perhaps it is not so surprising that market sentiment feels so redolent of that seen in February/March 2025 – a period dominated by worries over persistently high US interest rates ( with little or no room to cut) US trade and tariff issues, concerns over the massive expansion of AI related Cap-Ex by the Mag-7.
Chart 2: The S&P bellwether
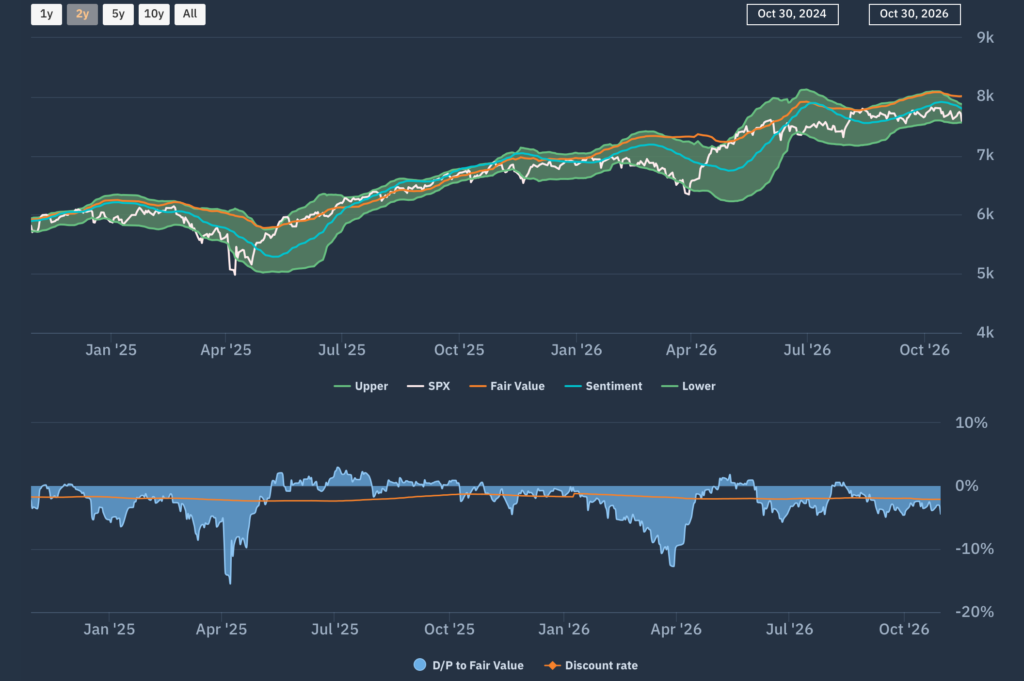
If we take a look at the Apollo market chart for the (market Cap weighted) S&P500 shown in Chart 2, we can see how the index level – having settled into the upper (positively trending) FV range during August, broke down into the (still positively trending) lower channel on September 9th and has stayed within the lower range ever since. In light of last week’s sell off, a test of the lower boundary looks inevitable.
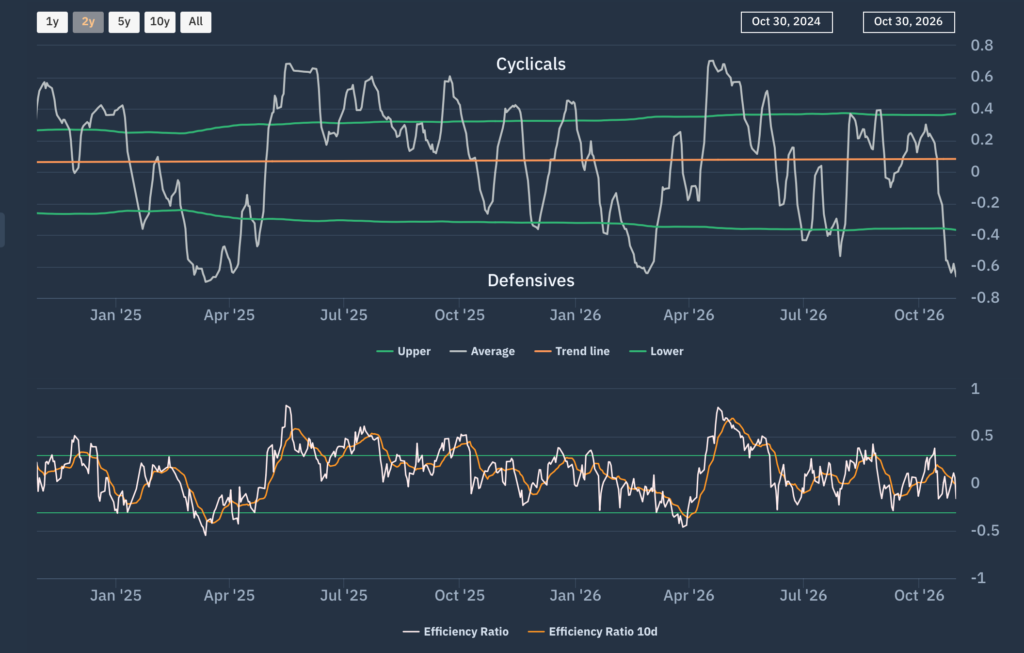
Moving down a level, we can look at whether there are any sector level dynamics now emerging that can be used to read across to other markets and Chart 3 is the Apollo Heat Map that we use to do this. This beta heatmap for the S&P500 shows the relative sector rankings in terms of rolling 1-month returns across the main US S&P500 market sectors, ranked by relative market beta from high beta (cyclical sectors) down to low Beta (defensive sectors).
What this shows is an initial continuation – but then an almost complete reversal – of the map from September’s article from mid-October onwards for the high and low beta sectors. Tech and Financials flipped as defensive consumer staples and healthcare picked up the rotational benefit. Thematics, however, continued unchanged with Energy continuing to lead and Real Estate and Industrials underperforming.
Our “Macro indicator” shown here on our Net beta chart (Chart 4) captures this shift back towards lower beta (lower risk appetite) and confirms the realty of the reality check that we warned of and back at the levels we saw in April 2025.
Chart 3: Apollo S&P500 Sector Heatmap
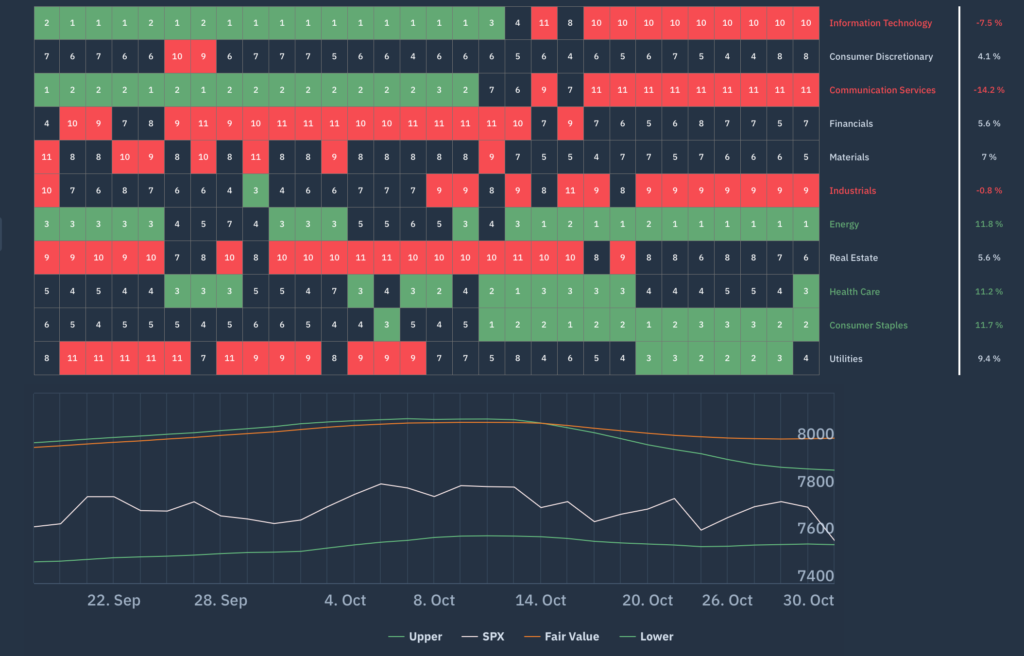
Chart 4: Apollo S&P500 Net Beta Chart
Forecasts and conclusions – Reality strikes
After the “hard check” of late October, it would be easy to assume that things have now realigned to the reality that, for months, would appear to have been staring markets in the face; namely the unsustainable nature of both market structure and US market dependence on the single theme of Frontier model AI. The cross checks from other markets – notably credit where related YTD issuance has now moved above $2trn – but also the secondary equity market itself where first Meta and now Oracle have also sought to raise capital – should by now have given enough context to these concerns to make a realignment of risk appetites more permanent.
And yet… even if more justified caution does now emerge, it is hard to argue against a market that is already pre-aligned to continue to pursue recent momentum stories (if not prices). The aforementioned (planned) Anthropic IPO is a (actually the) case in point. As I write, the narrative surrounding the company is being shaped for market acceptance of a forthcoming issue. This is eerily redolent of what we saw back in the spring of 2025, when the level of Hyperscaler Capex was initially coming under intense scrutiny and the “Mag-7” were selling off sharply. A sudden release of highly positive “evidence” of cloud demand (and hence “AI demand”) was apparently enough to overturn the scepticism and rally the sector and the market as a whole.
However, despite all interested parties strongly inferring that this was all down to a surge in “real AI demand”, eighteen months later there remains no actual “split out” of AI revenues by any of the hyperscalers and we simply cannot quantify the scale or the rate of growth of this demand. This alone should give rise for caution over whatever data is set to be released in coming weeks but there is a very real risk that it does not. Simply put, even if the whole feel of the market has become more cautious since the revelations of “circular financing” that came out earlier this year, there remains an awful lot of vested interests who will need to see a successful launch of ANT. For as much as global Macro in the form of local and international politics, interest rates and commodity prices will matter between now and quarter end, beyond the potential singularity relating to “Mount Doom”), it is likely to be the reality of how successful or otherwise an ANT issue turns out to be that will set the markets course into 2027.