
On May 29 we posted a comment on BP – ‘it’s a gusher’ and what you would have seen (and can see if you take a look at past posts) is the chart of the right below.
The chart is the Apollo Margin of Safety chart which gives users a continuous, objective assessment of the risk and reward of holding a position, long or short. The point being the share price traded a historic premium to FV that since 2018 is never exceeded. The inference being obvious.
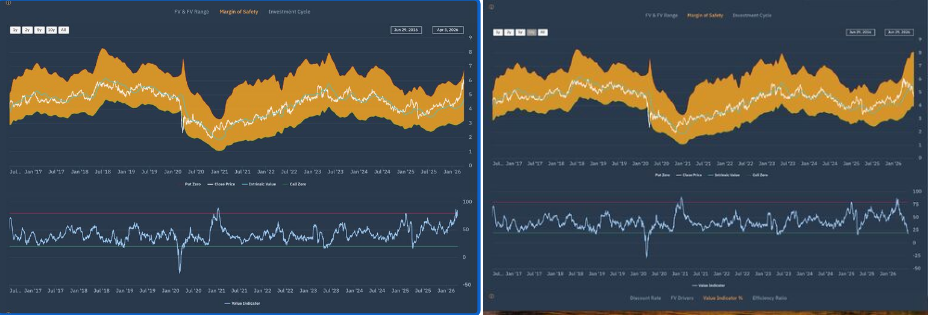
Roll on one month to today and discount to value is at the opposite extreme with the Brent Crude trading close to $73/share. The lower half of the chart shows the Apollo Value Indicator score. The inference being obvious.
I point this out because (as I have said many times) the best information from the best people ensure investors/clients never miss an opportunity and smart people naturally want to work with smart people and smart products. It’s a ‘Need to Know’ moment.