

The pressure ridge

We call our regular Apollo based commentary “The Weather report”. The analogies that we can make with the multiple elements of Value, Momentum and Uncertainty impacting markets in a continuous way chimes nicely with the idea of Currents, Tides and Winds, all impacting the navigation of the high seas. Whatever the nature of the vessel concerned or the skills, experience and capabilities of the crew, the Maritime Weather Report is an essential part of the information system that is required and so the Market Weather Report is designed to perform a similar, essential function.
As we start May, the nightmares of March appear to have dispersed and a fair amount of the angst over Geopolitical events either reversed or evaporated as we moved through April, despite the reality of oil prices remaining well above the psychologically damaging $100/bl level. The earnings season in the US is clearly helping: for now at least, earnings are beating expectations and risk appetite for Equity exposure appears to have re-emerged with a vengeance. Volatility has compressed with the VIX ending the month back at the levels of end-January. The net effect of this broader market recovery in April has left the S&P500 index back into (modestly) positive territory for the year to date.
This may yet prove to be a “phony war” but, in the meantime, we appear to be returning to many of the themes that we started the year with – the rotation towards real assets and companies with defendable cash flows, a healthy scepticism towards some of AI’s (over) promises, diversification away from over concentration on the US in general – and Tech in particular – all have returned to centre stage. To an extent it seems that these themes have been “battle tested” over the intervening period and found to remain sensible. Superficially at least, it appears that the panic of March, now offset by the rebound in April, is being treated in much the same way as the “Tariff disasters” of 2025 – news to be assimilated, reviewed but ultimately, simply absorbed as a marginal shift in the landscape – not a reason to change strategic plans.
But what IS the plan?
What is often overlooked by those commenting on financial markets is the interplay between strategy and tactics – when the strategic positioning is set – themes and investment ideas are incorporated into portfolios and expectations are a balance of probable outcomes and the potential risks to them. And then something happens. Tariffs. An outbreak of hostilities. A pandemic. Suddenly it is no longer about what you were positioned for but about how to tactically manage the new reality until the situation changes and the prior strategy can be re-engaged with – or scrapped altogether.
Although the latter can (and does occur) by far the most common outcome is the former. The best (or worst) laid plans run into externalities that block or prevent the strategy from being implemented. In such circumstances it is easy to realign with the short-term news flow: to attempt to respond strategically to current events when, in reality, it makes more sense to understand how to tactically respond whilst still maintaining a strategic exposure to what comes next.
However, there are times when the prior strategy really needs to be reviewed, and quickly.
Recent events are a case in point. As we noted last month, even after a late month rally, the shock to portfolio (and index) returns in March still left the Benchmark long-only indices down by more than -5%, as volatility exploded upwards and prior momentum trades collapsed in the face of new geopolitical realities. The emergence of extreme tail risks forced active de-risking of all asset classes and many high-profile Macro Hedge Funds ended the month seriously underwater. Interest rate positions and spiking volatility were the biggest source of declines, whilst commodities surged to the (temporary?) benefit of some commodity trading funds. It was a serious reality check.
Above all, the plan is to stay engaged. A “rush to cash” might look to be smart in the moment, but it provides little benefit in the face of the new, uncertain world that follows afterwards. At Libra, the way that we try to manage these situations is by an unemotional, systematic periodic rebalancing of risk and factor exposures. This is tactical. We do not want to enter a new phase of market conditions either needing the past to be restored or for the future to play out in a yet to be determined manner by which we are setting a “hopeful” strategy.
If we extend our nautical analogy here, we are in a sailing race. The strategy is to win (of course) given the prevailing conditions, but the tactical awareness of how to manage the conditions during the course of the race is key. All the boats in the race start from the same point and enter the initial phase together, jockeying for position, seeking to gain “lift” from the freshening winds and watching out for the pressure ridges that form on the water ahead as the guidelines for where to run. Everyone operates at full pace, with those tacticians best able to read the shifting patterns of wind, tide and current moving ahead.
However, if the fleet hits a pressure barrier, the winners and runners-up start to bunch up. Hard won positions drop away and, in these conditions, it often makes more sense to use an autopilot as opposed to hand steering the boat. The crew can get a rest, rigging and gear can be checked and managed. So long as you avoid the dead calm of the pressure centre, the stage can be set for the next phase of the race.
Pressure, Pressure!
This is where we are now. The “losers” of March have (mostly) caught up with their peers with the benefit of April’s rally. As pressure dropped, a lot of vulnerable positions have eased and, for those who have not been forced sellers, the hope and expectation is that they can resume the “race” on essentially the same tack as they started. Except of course they cannot. A flat Q1 for most US exposed equity funds hid the realisation of over concentration on Tech and the vulnerabilities of over leveraged private credit markets in the face of rising interest rates. The canaries in the coalmine of exponentially increasing AI Cap-Ex requirements and loss-making revenue models, expectations of major IPOs coming down the pipe and, now, the fiscal realities of military expenditure all point to the inability of traditional portfolios to risk manage these kinds of externalities.
The tacticians need to decide when and how to break through the pressure ridge in search of fresh air and once again get positive “pressure” back in their sails. That might not mean wholesale restructuring of portfolios, but it does imply that for those who badly lagged in March, there is no excuse not to learn the lessons from that period and try not to be caught out again. For those who did “rush to cash” they need to be actively thinking about how they plan to get back in the race. They might not have lost ground to their peers YTD, but they will need to get some sail up fst if they are to remain in contention.
Review of Performance – under the surface
In taking our normal look at some of the recent performances of the main market indices through the lens of the Apollo strategy models (price performances are to index close values from 30 April 2026) we continue to build upon our thoughts over the last two months. As part of our Smart Alpha Evolution, we have added in the performance of two additional strategies – an extension strategy – a 130:30 version of the Global Large Cap Multi-Factor (long only) Strategy and a “Market neutral Long Short” version of the Global Strategy. The benefit of these additional strategies is the ability to gain insight from the non-correlating nature of the long/short and the leveraged benefit of the extension strategy.
The 6-month returns in Table 1 take us back to the end of October whilst the 3-month number taking us back to the end of January. We have retained the 1-month return numbers that we added to table 1 last month (below)
Table 1: Performance Report (price returns %)
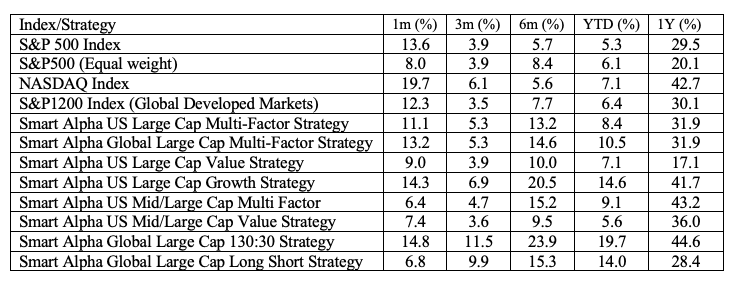
The bounce back in monthly performance has dominated news flow after the sharp selloffs in March. These outsize performances have helped to lift overall 3m and 6m performances back to “more normal” levels of returns on an “annualised basis”. The 1Y % return figures also look flattering but reflect the base effects from last April and the “Liberation Day” rollercoaster over the course of Q2 2025; making point return measures more volatile.
The best datapoint to monitor is probably the YTD figure. A 14% rebound in the (market Cap weighted) S&P500 was enough to turn round the YTD numbers for the S&P500 from (-5%) to (+5%) over the course of April whilst the NASDAQ’s YTD figures have moved from (-7%) to (+7%). This suggests that whilst March was an outlier month to the downside, April’s rebound did at least provide a positive lift from what was essentially a flat “pre-war” performance for the US markets in 2026.
Alongside these we can see the selection of Smart Alpha strategies – including the additional ones referred to above – that we run (and publish – see https://www.libra-is.com/strategies ) reflected here. On that YTD basis, there is already clear water between the Smart Alpha Multi-Factor strategies and their respective benchmarks but the standout for both the Leveraged (130;30) Global Strategy and the Long/Short Global capture the benefits of non-correlation in the March selloff. For the Long/Short in particular, a (+3.7%) performance in March followed by a (+6.8%) increase in April is a reminder of precisely why a properly integrated long/short Equity strategy is an invaluable component of an overall portfolio.
The Growth/Value trade-off can be seen in the data for the various US Value and Growth strategies where we see a strong rebound in Growth stories leaving Value lagging. We are able to generate these distinct single- style strategies by virtue of the fact that we categorise all the stocks under coverage by “style factor” based upon our own, fundamentally derived classifications (Value, Growth, Quality, Junk etc.) using the Apollo model for expected returns. This allows us to dive a little further into the drivers of returns. Outside of this we have the multi-Factor strategies, where we seek to maintain a “Factor neutral” approach at each rebalance so that we are not taking style bets. At the headline level, the Global 1200 Multifactor strategy is up (+11%)YTD, whilst the US Large Cap Multifactor (+8%) – suggesting that a “spreading of Factor risk” across the Long only groupings of Value, Deep Value Quality and Growth has paid off in terms of diversification.
Risk (and returns) by Factor
In terms of the factor drivers that we can see in Table 2, the differentiated drivers of the Global Multi–factor portfolio from the sub-portfolios YTD has been from Quality (+21%) and Growth (+16%) whilst Deep Value (+5.2%) and Value (+0.5%) have lagged heavily. Whilst April’s rebound from the “red block” of March was more even (still led by quality) this remains an important divergence in the current market. Even if further de-risking looks to be off the table for now, recent equity winners and the potential casualties in relation to increased uncertainty about more intangible future growth point to neither Growth or Quality being the guarantors of excess returns over the coming months. Our regular 2-month rebalance (22 April) has taken us back to equal weighted exposures at a factor level across all of the multi factor strategies.
Table 2: Global Factors
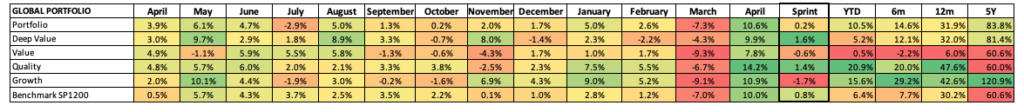
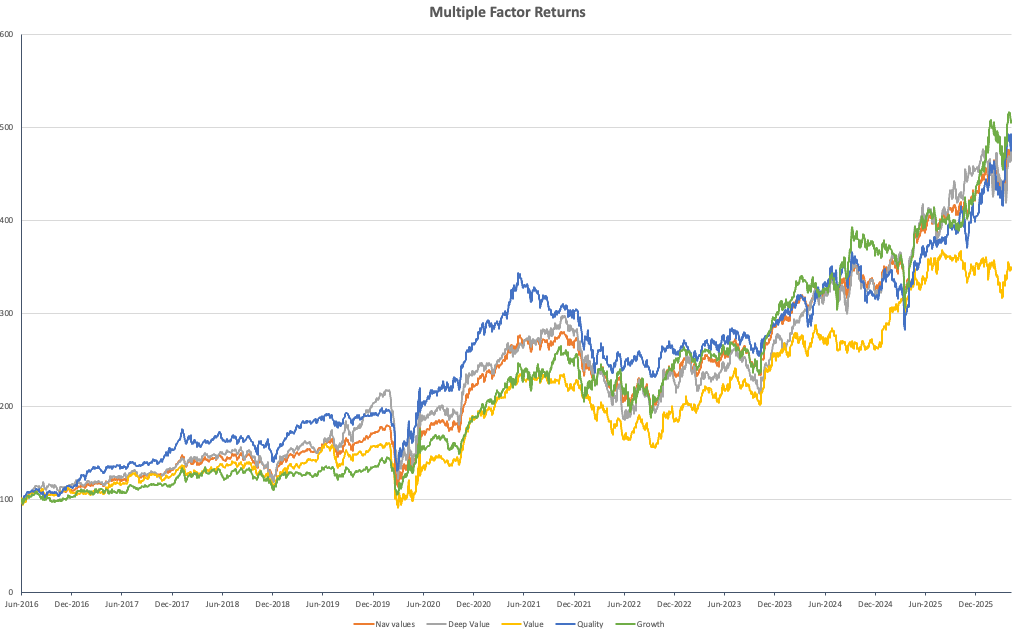
Chart 1 illustrates the longer-term trends of factor returns and illustrates this point further. Quality – the dominant (blue line) from 2016 onwards remains aligned with both the total portfolio (orange) and clearly ahead of value (yellow) over the total period with Growth a clear compounding winner over longer horizons and, the dominating factors of late. Meanwhile, the relative under-performance of Value is thrown into sharp relief in the chart, suggesting that broader risk appetites have already been muted in recent times and that style factors are perhaps playing second fiddle to payoffs when it comes to compounding returns.
Chart 1: Compounding returns
Weather Forecast – back to the race
At time of writing we still do not have clear guidance on the geopolitics of what is happening in the Middle East or elsewhere. Oil prices remain elevated and the situation in Ukraine appears to be little changed since the start of 2026. Meanwhile, political, and economic calendars are now building up new pressures for the second half of the year. A new Fed Chairman, the US Mid-Term elections and the inflationary implications of $100 +/bl oil are on the minds of the US markets, but longer term tensions with China, the risks to Cuba, pressures on global supply chains as well as issues over de-dollarisation, The UAE leaving OPEC, pressures building within the BRICS+ countries ahead of Elections in Brazil in October are amongst a plethora of potential flashpoints and headline grabbing events to content with.
From a market internals point of view things are certainly calmer. De- risking has undoubtedly been taking place in recent weeks Volatility has compressed back to the levels of early 2026 whilst it would appear that general flows have improved and “positioning” along with it.
Chart 2: The S&P bellwether
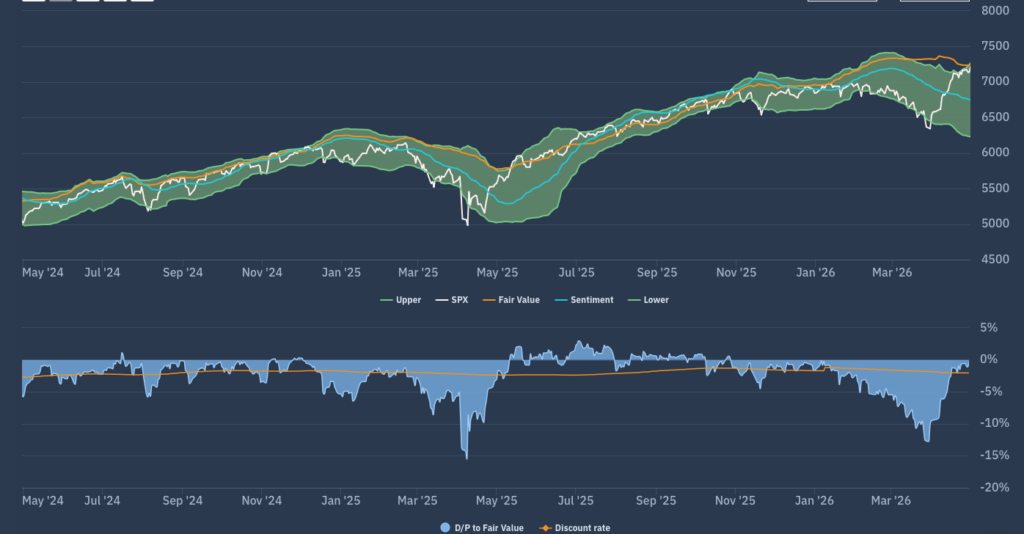
If we take a look at the Apollo market chart for the (market Cap weighted) S&P500 shown in chart 2 we see a market that has traversed from (a break back-up through) the lower boundary of the Fair Value range at the end of March to the top of the FV range over the course of a month, erasing the discount to FV almost completely over the period. This is quite a turn-around as the trend in Sentiment (blue line) remains directionally downward. However, we can see that it is very similar in style and degree to the post April 9th 2025 rally and suggests that a relief rally could certainly be sustained with a “fair wind” into Mid year.
Moving down a level, we can look at whether there are any sector level dynamics now emerging that can be used to read across to other markets and Chart 3 is the Apollo chart that we use to do so. This is the Apollo beta heatmap for the S&P500 that shows the relative sector rankings in terms of rolling 1-month returns across the main US S&P500 market sectors, ranked by relative market beta from high beta (cyclical sectors) down to low Beta (defensive sectors).
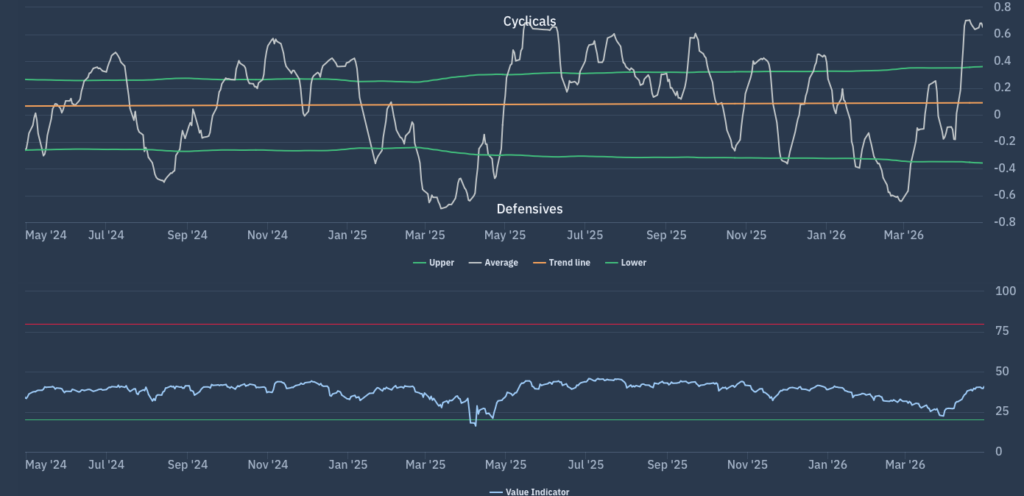
We can observe a total reversal of last month with a shift back towards unequivocally positive performances across the higher beta cyclicals versus a universally positive swing towards defensives. Our “Macro indicator” shown here on our Net beta chart (Chart 4) reinforces the similarity to April 2025 where we can observe the net exposure bias between defensives and cyclicals shifting from where, last month, we were at the same level of 5-year lows experienced in April 2025 back up to new 10-year highs at the end of April.
Chart 3: Apollo S&P500 Sector Heatmap
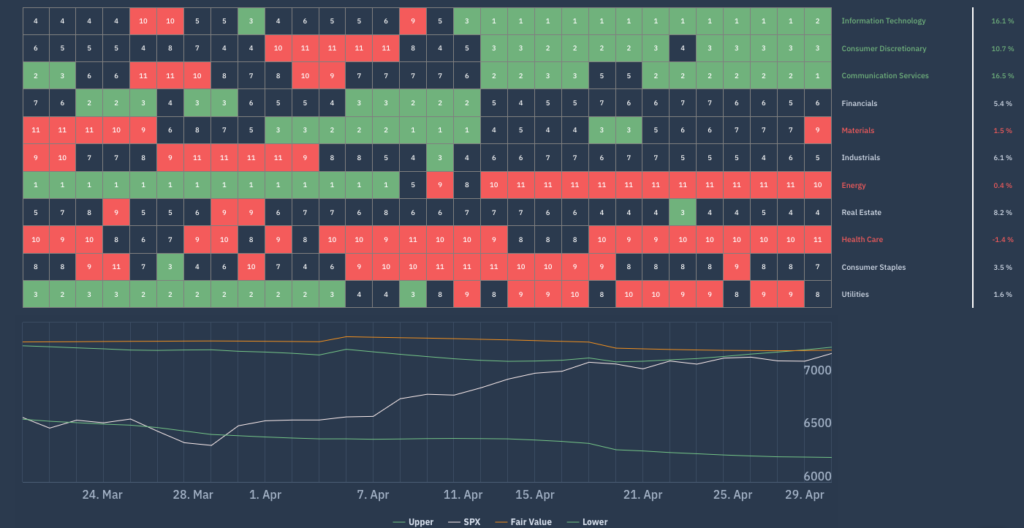
Chart 4: Apollo S&P500 Net Beta Chart
Forecasts and conclusions
After a phase of steady-then-dramatic declines followed by an equally dramatic rally, it would come as no surprise if markets were to become slightly neurotic in the coming weeks. Knocked around by news flow and social media postings as much as by fundamentals of longer lasting geopolitical events, it is easy to imagine a market that, having “de-risked” itself now begins to “de-rate” itself too.
It is tempting to look back (in hindsight) at the events of April 2025 as a counterpoint to this and suggest that the lessons from April 2025 are that those who didn’t buy back into the rally early spent much of the second half of the year chasing the market. To an extent this was true, but we should not forget that, by mid-year, even with the post April rally, the market as a whole was not generating a positive return YTD (and a lot of funds were still seriously underwater). To return to the sail race analogy, when the race restarts, those who can tactically “break out” in search of new “air” will benefit the most. Those are the boats that were tactically effective in the first phase and were able to prepare for the next phase whilst things were calm. Unlike 2025, we enter May with some moderately positive returns on the board for markets and the majority of funds. The temptation to hedge and hold onto those first half gains will only increase in the coming weeks given the uncertain macro backdrop and we would not be surprised to see the net beta chart return towards neutral. You don’t have to take extreme risks to win the race – but you do have to participate and you do need to be “Smart” about how you do so.