
New Horizons

We call our regular Apollo based commentary “The Weather report”. The analogies that we can make with the multiple elements of Value, Momentum and Uncertainty impacting markets in a continuous way chimes nicely with the idea of Currents, Tides and Winds, all impacting the navigation of the high seas. Whatever the nature of the vessel concerned or the skills, experience and capabilities of the crew, the Maritime Weather Report is an essential part of the information system that is required and so the Market Weather Report is designed to perform a similar, essential function.
Although the market does keep to its own timetable – see our report on The Apollo Market Almanac -the start of the calendar year inevitably leads market commentators and investors alike to speculate upon the forecast return for the following twelve months. Typically, these take two forms: year-end price level targets for the headline indices or targets for “returns” related to an index or asset class – either of which can make for dramatic headlines at the turn of the year – “Nikkei back to 40000 – back up the truck!” , “Nikkei set to drop to 10000 – sell everything!” or “S&P500 to rise by 30% – Bull Market!” , “S&P500 to contract by 20% – Bear market!” as these predictions become treated as relative certainties by the media. However, the majority of asset allocation models will pump out something far more prosaic in the form of their Capital Market Assumptions (CMA’s) and more along the lines of “global equity returns over the next 10 years forecast to be 6-8%” – seemingly regardless of the actual returns seen from the markets themselves.
Of course, the former is mostly financial sector PR – being accountable for a “ correct” headline forecast of the market over a prior period is gold dust to a sales team wishing to sell itself as having better insight than its peers even though, in reality its mostly a case of “better to be lucky than good”. Being bullish is par for the course (bear stories tend to persuade investors not to part with their money) but the rise of passive investing has led to a situation where return forecasts for “the market” are tending to blur the lines between a CMA assumption for an asset allocator that treats Large Cap US equities as a single investible asset from a multi asset perspective and a “…how much could I expect to make on my savings in, for example, the SPY ETF over the coming year if I put my money into an investment account” where the SPY is viewed as a form of default investment for 401K investors.
For either use case, even if they sometimes resemble the “monkey’s throwing darts at the Wall Street Journal” form of stock picking, these expectations are actually quite a significant data point for decision making. They also feed into the idea of a coherent advisory framework. If the S&P500 is going to increase by 20% next year – how is that going to happen? What stocks are driving that return? – is it all about the Magnificent 7 – and if so, how much risk is there to that not happening?
Apollo Genesis – bottom up forecasting for 2026
The reason that I am focusing upon this is that it was the latter point that provided the inspiration for my development of the Apollo equity valuation system back in the early 2000’s and the whole framework of analysis that we follow at Libra to this day. I will go into the history of this in a separate piece, but the whole ethos of what we refer to as “top down from the bottom up” comes from the idea that if you can forecast the value and the expected return systematically for every stock in a market – then you can forecast the market return from the bottom up. More importantly from our perspective, because this is not conducted as a once-a-year exercise but run as a continuous daily process, it allows us to forecast not just a point in time return (to calendar year end) but to forecast rolling market (or sector or portfolio) level returns and develop a proper risk framework and probability range in relation to our central forecasts.
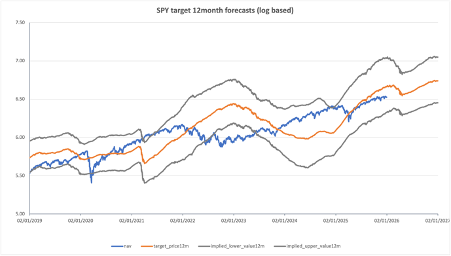
Chart 1 shows this exercise for the most widely held ETF – the SPY – where the blue line shows the actual level of the S&P500 proxy ETF, and the orange line shows the central expectation forecast for the NAV of the ETF twelve months hence. The grey lines represent the upper and lower boundaries of the probability distribution that corresponds to the central forecast. The chart is log based in order to demonstrate relative performance and the longer-term growth dynamic of the market and their respective probability forecasts more easily. For the headline grabbers, in index terms, the end 2027 forecast is 845 vs 682 at the start of 2026 – a rise of 24%. The upper and lower index levels are 1152 and 634 respectively – suggesting a market that, despite current concerns over valuation amongst some of the big names, may have – on a 12-month view – very little downside with a lot of potential upside.
In the interim, the implied risk low of 536 in April 2026 – some 21% below current levels is obviously derived from the depths of April 2025’s fear and panic over “Liberation day” but the current, modest 2% discount to the target return for the same date in April 2026 perhaps highlights how stable the trend-up in the market actually remains. For contrast, the Apollo bottom-up determined equal weighted SP500 forecast on this basis is (+11%) for 2026 – in line with its 10-year, top-down annualised historic return (+10.3%). Our current twelve-month forecasts for the “Magnificent Seven” are (+26%) equal weighted and (+30%) market-cap weighted.
Chart 1 – Longer term forecasting the S&P500
Review of Performance – steadier ships
I will return to the forecast outlook later in this piece but, as has become the norm for the Weather Report, we can take a closer look at some of the recent performances of the main market indices through the lens of the Apollo strategy models. With the returns for 2025 as a whole in the form of the 1Y column (price performances are to index close values from 2 Jan 2026) 6-month return taking us back to the start of the summer shut down in the US ( July 4th) and the 3-month number taking us back to the run up to the Q4 reporting season, these reference dates are, once again, helpful in assessing the general state of the markets
Table 1: Performance Report
| Index/Strategy | 3m (%) | 6m (%) | YTD (%) | 1Y (%) |
| S&P 500 Index | 2.1 | 10.1 | 0.2 | 16.8 |
| S&P500 (Equal weight) | 1.2 | 5.0 | 0.7 | 9.5 |
| NASDAQ Index | 1.7 | 13.9 | -0.0 | 20.5 |
| S&P1200 Index (Global Developed Markets) | 3.0 | 11.0 | 0.4 | 21.5 |
| Smart Alpha US Large Cap Multi-Factor Strategy | 7.3 | 9.3 | 1.3 | 28.4 |
| Smart Alpha Global Large Cap Multi-Factor Strategy | 4.7 | 7.5 | 1.6 | 32.8 |
| Smart Alpha US Large Cap Value Strategy | 0.9 | 1.8 | 1.0 | 17.2 |
| Smart Alpha US Large Cap Growth Strategy | 10.1 | 14.5 | 2.0 | 25.4 |
| Smart Alpha US Mid/Large Cap Multi Factor | 7.7 | 10.2 | 2.0 | 32.2 |
| Smart Alpha US Mid/Large Cap Value Strategy | 4.6 | 7.4 | 1.4 | 30.1 |
The divergent returns of the S&P500 equal weight and market cap weighted indices that was so dramatically evident in last month’s 12 month returns (+2% vs +14.2%) has moderated as the base effect of Q4 2024 came through, but remains a reminder of how the Mag-7 story is in many ways the S&P500 (market cap weighted) story. An equal weighted basket of the Mag 7 has essentially delivered the same return as the S&P500 index (16.8%) over the last twelve months, but the former has the benefit of being explicit about the risk concentration involved towards these stocks. Interestingly, whilst the performance of the equal weight index over 2025 (+9.5%) shows up as poor in comparison to its Market Cap peer (16.8%) it is essentially in line with its own, largely stable, historic return profile of an annualised 10% price return. It is also closer to the levels of expected return that most investors had started out the year with of 12% for the Market Cap (essentially a Geometric mean average of the S&P500 annual returns over the prior decade). Expect most investors to look for the equal weight to provide a similar return for 2026 – our model forecast for the equal weight index is (+11%) for 2026.
From a more global perspective, we can look at the performance of the S&P1200 developed market index (the S&P 500 plus 700 “other Developed market Large cap” stocks). This benchmark has 3 and 6-month performances that continue to correspond closely to the US large Cap (S&P500) index and a slightly higher, NASDAQ level of 12-month return; up (+20%) in US$ terms. As such, it continues to provide a credible “diversifier” for those worried about over exposure to the US economy per se – although with around 69% of the Index being made up from US stocks this is still heavily US-centric and retains the same market cap weighted bias towards the Mag 7 that the S&P500 exhibits.
“Smarts” from Smart Alpha
We can use a selection of the Smart Alpha strategies that we run (and publish – see https://www.libra-is.com/strategies ) to capture some of the underlying dynamics that appear to be at play. We construct these portfolios to help us access the excess returns that are available from the markets on an ongoing basis but, in doing so we are also able to gain a degree of insight as to what might be “working” at any point in time that can help shape expectations for the coming investment period.
With the Libra Smart Alpha strategies, we categorise all the stocks under coverage by “style factor” based upon our own, fundamentally derived classifications (Value, Growth, Quality, Junk etc.) using the Apollo model for expected returns. We then construct concentrated (48-stock), equal-weight, factor-based portfolios selected from the relevant underlying universes (S&P500, S&P1200 etc.) to reflect the “best” performing elements of those universes and generate excess returns.
What we can see from those portfolios (see Table 1) is that on a six-month basis (on an equal-weighted basis) the difference between US mid and large cap (+7.4%) and US large cap value (+1.8%) whilst not as significant as it was last month, remains a point of difference for value investors. Large cap value may have shown some recovery over the last 3 months, but it is clear that large cap growth has been the stock selection of choice over that period (+10.1%). For the last 12 months, Apollo Smart Alpha multi-factor US large cap (48 stocks equal weighted) is up by 28% – a dramatic premium over the equal weighted benchmark and, indeed, the Market Cap biased benchmark. Those questioning the potential alpha available via stock selection and the importance of not only what to own – but what not to.
Looking at this from a broader, global level, we can dig into the top line and factor performances of our Global S&P1200 Smart Alpha strategy for further insight. The market cap weighted benchmark (which includes the S&P500 stocks but adds in 700 other large cap stocks) showed an earlier recovery from the April sell-down than the US benchmarks, but that difference has now narrowed as the performance over the second half of the year has converged with that of the S&P500 (6-month performances of (+11%) and (+10.1%) respectively). The global benchmark 12-month performance (+21.5%) in US$ terms is ahead of both the NASDAQ (+20.5%) and the S&P500 benchmark. As we have noted previously, our Smart Alpha strategy based upon this benchmark’s universe rode out the April sell-off and was back in positive return territory within a week. As a result, its exceptionally strong 12-month performance (+32.8%) has been a result of building upon that first half base: generating a steady excess return over the rest of the year with only one negative month (July). (There was an additional benefit from a weaker US$ in H1 – see below.)
Risk (and returns) by Factor
As a reminder, when we construct a Smart Alpha portfolio, we not only rank stocks based on our risk adjusted expected returns, but by investment factor category. This is a crucial part of the risk management process embedded within our portfolio construction. At each rebalance we construct a 48-stock equal weighted portfolio with equal investment factor exposures to the factor(s) concerned. For example, we can construct a simple “Quality portfolio” by selection from stocks that Apollo categorises as Quality or a “Value portfolio” with equal exposures to Value and Deep Value stocks. We can also construct a factor neutral portfolio ( the one shown here and in table 1) with equal exposures to Deep Value, Value, Quality and Growth (with zero exposure to Junk or other high-risk categories) This ensures that there is no unintended or persistent factor bias embedded in the portfolios.
We remain big advocates of this strategic approach. In terms of the sector drivers that we can see in Table 2, a major impact on our Global Multi–factor portfolio from the sub-portfolios that we build as part of the process has been a big factor bias towards deep Value (+40%) and Value (+32.5%) compared to Quality (+21.1%) vs Growth (+20.8%) on the 2025 calendar year measure. Deep Value bucket and Growth Bucket both surged in November following the rebalance of the October Sprint with Growth continuing to outperform into December-as we rebalanced into the latest Sprint (+5.5%).
Table 2: Global Factors
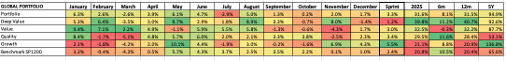
If we contextualise this over slightly longer time frames, the last six months saw the overall Smart Alpha portfolio up by less than the benchmark (8.1% vs. 10.5%) but 2025 (+31.6% vs. 20.8%) as the recovery path was more measured throughout the year as a whole – performing more consistently throughout the whole period.
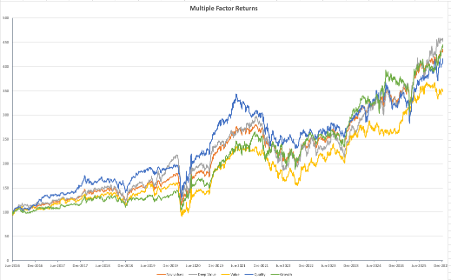
The longer-term compounding portfolio and sub portfolio NAV chart shown in Chart 2 highlights how the factor outlooks have diverged not only recently but over the longer term. The disruptions in 2020 continue to leave the 5-year return numbers a little misleading at the headline level but visually Quality – the dominant (blue line) from 2016 onwards remains aligned with both the total portfolio (orange) and clearly ahead of value (yellow) over the total period with Growth a clear compounding winner over longer horizons. Meanwhile, the sharp drop off in relative performance of Value is thrown into sharp relief in the chart.
Chart 2: Compounding returns
Weather Forecast – Currency currents
For a year that was supposed to be difficult to invest in, 2025 “turned out alright in the end” for most equity investors. Any annual return for the SPY investor over 15% has to be marked down as a good result in “401K-land” and with the US political narrative around economic recovery and revival being aligned strongly with the performance of the stock market, what had appeared to be an economic act of self-harm in April, paved the way for a 35% rally from the lows into year end. Meanwhile, a 7% drop in the trade-weighted US$ over the first half of the year gave a boost to non-US$ assets in global (US$-priced) portfolios that has led to still higher returns (+29%) for non-US MSCI All World equities.
This has led to much speculation over the relative attraction of non-US assets in 2026, but it is worth noting that despite the annual headline drop in the US$, the Trade-weighted US$ has been essentially trading sideways since July and, in reality, has simply returned to the bottom of its 2022-2025 trading range. Prior to that, the US$ was significantly weaker on a trade weighted basis (around 110) and we suspect that it is real world demand for US$ following the early 2022 surge in energy prices that kicked the US$ higher. With Oil prices now back to Dec 2021 levels, (spot WTI tracks still closely with the conflict in Ukraine for obvious reasons) a steady 120 on the US TWD is probably the best one can hope for (in terms of US$ strength). A weaker US$ is a risk for non-US$ based investors to manage in 2026 and clearly supports the diversification narrative (away from pure US exposure towards global and away from US Tech dominance.
As we have made clear in this piece over many months, we do not see the need to split the world into US vs non-US exposures but prefer to reflect – on an equal weighted basis – exposure to all developed market assets on a stock selection basis. We report all returns in US$ for comparative reasons, but clearly the currency base of the investor is the main reason for management of currency/county exposure longer term. The 2025 performance of our Global multi-factor strategy (+31.6%) where we risk manage factor exposure via regular rebalancing and stock selection (but do not make country or factor bets in order to do so) is testimony to how both US$ and non US$ assets can be successfully combined into a global portfolio model without the requirement to make country or sector based exposure decision.
Returning to our familiar nautical (financial) themes of Currents (value), Tides (momentum), and Winds (uncertainty) we would note that 2025 was not a year for factor persistence. Even as overall market performance has been acceptable for most benchmarks, little appears to have really gone to plan on the active front. Value surged – then faded. Momentum reversed and then stalled. Growth rebounded, retreated, and finally surged. Uncertainty persisted until it was overwhelmed by rhetoric. Currents, tides, and winds all combined to push markets persistently away from expectations, and rewards did not really appear aligned with risks. The contrast between market Cap weight and equal weight S&P returns highlights that even though passive (via size), stock selection made a significant difference to returns and, with the spectre of AI risk now in the background for the Mag-7 in particular, the inability to diversify away from this risk factor will be causing sleepless nights to those who have chosen to handicap themselves into these kinds of tracker products.
Looking forward to 2026
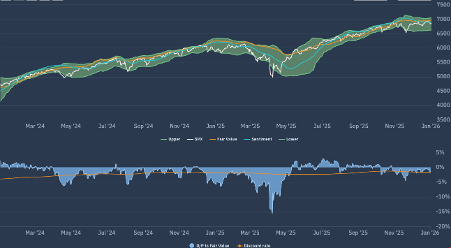
To add context to this, we can review the Apollo market chart for the (market Cap weighted) S&P500 shown in chart 2 below. The increase in market certainty/predictability that could be seen over the summer months (the narrowing of the FV range) has widened significantly since November as uncertainty about near term returns (particularly in relation to talk of “an AI “bubble”) and risk unwinds in Crypto accelerated. On a similar basis, whilst our proprietary measure of sentiment (the blue line) has now flattened. As we noted in the November report, we anticipated that the shakeout for equities in November to be manageable and so it has proved. Whatever the view on issues such as AI, Mag-7, Crypto or Geopolitics, the market is entering 2026 with these risks clearly in view. The width of that FV range (when contrasted to the narrowness of the summer) is more “normal” on our view – redolent of the early part of 2025 when a steady drip-drip of relative disappointments in Tech led that sector to perform poorly in Q1.
Chart 3: Apollo FV range for S&P500
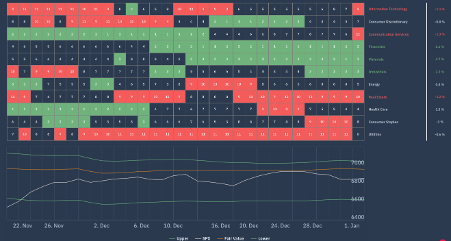
Is that set to repeat itself? Chart 4 is another interesting counterpoint that we use. This is the Apollo beta heatmap for the S&P500 that shows the relative sector rankings in terms of rolling 1-month returns across the main US S&P500 market sectors, ranked by relative market beta from high beta (cyclical sectors) down to low Beta (defensive sectors).
This illustrates how as sentient towards Tech has already weakened and the sector has already been taking a back seat to Financials, Materials, and Industrials. Note too, the relative underperformance of defensives over the last month as broader equity market sentiment has rallied. From an Apollo perspective, this broadly beta-neutral performance of the market by sector (i.e., not driven by extremes of relative beta) is what we would describe a “net beta neutral” and fairly typical of how most calendar years start. However, it remains a “Macro indicator” we keep an eye on as earnings reports begin to feed through.
Chart 4: Apollo S&P500 Sector Heatmap
Forecasts and conclusions
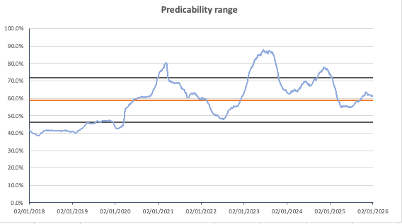
We began the report with a few thoughts about the outlook for 2026 in terms of the headline S&P500 index through our own, Apollo forecast lens as a means of contextualising how top down and bottom-up forecasts of returns should be combined on a continuous basis for understanding risk and return. Those forecasts highlight a generally positive view on the market but, as Chart 1 illustrated, with a wide range of probable outcomes in respect of it. The “width of this probability range – like the FV range width in Chart 3 provides us with another helpful indicator of uncertainty – or as I prefer to refer to it – predictability. There are periods of time where this range is widened out by increased uncertainty and how predictable the market is inversely related to that- the wider the range – the less predictive the model. Chart 5 shows this as an historic time series within a simple Standard deviation framework and we can see that current levels of “predictability” are close to normal (also visible on the log-based Chart 1). Despite the volatility, directional returns have been solid since the market lows of 2022 and the sense that market beta is persistent underpins our generally positive market forecasts.
Chart 5: Forecast predictability
Having noted how style investing was whipped around in 2025, we continue to take the approach that factor timing is not an effective method of asset selection and risk management beyond ensuring factor exposures are periodically balanced. Even if growth has the capacity to outperform and compound over time, it made only around half the return (+21%) in 2025 that Deep Value (+39%) did on our global model in 2025. Meanwhile, Value – up (+32%) for the year as a whole, was in negative territory (-0.3%) over the last six months.
Regular “rebalancing to neutral and equal weight” in terms of factor level risk alongside relatively concentrated (around 50 stock) active stock selections based upon our own forecasts of expected returns provides both insight and reward. We can’t predict the exact nature of the weather ahead, but as we noted in our piece back in May “Round the Horn” we have already moved into a “New Ocean” where the currents, tides and winds may feel much the same but end up having sometimes quite different impacts upon us than anticipated. For then – and now – the title of this forecast “new horizons” seems a very credible piece of advice for such conditions.