
Summer’s over – back to work

We call our regular Apollo based commentary “The Weather report”. The analogies that we can make with the multiple elements of Value, Momentum and Uncertainty impacting markets in a continuous way chimes nicely with the idea of Currents, Tides and Winds, all impacting the navigation of the high seas. Whatever the nature of the vessel concerned or the skills, experience and capabilities of the crew, the Maritime Weather Report is an essential part of the information system that is required and so the Market Weather Report is designed to perform similar function.
The mid-August rebalancing of the Apollo Equity strategies has recently been completed, and in this report, we take the opportunity to review how the markets and our strategies have performed over the summer months and where we now see the prospects for the markets as we move out of the summer and into the autumn. Back in July we made the point that, with our own strategies having performed well in the first half of the year, we were confident that they would sustain the overall level of returns through the summer without the need to “…put out all the sails” in an attempt to catch up in performance terms. This allowed us to run with essentially unchanged strategies beyond our periodic rebalancing of the portfolio’s factor risk exposures (back to neutral) and retaining our regular stock (re)selection approach, using Apollo’s risk adjusted expected returns forecasts.
Performance over the summer has been a major topic of conversation as far as the S&P500 is concerned, with a 3-month performance of (+14.3%). Much of this was due to the catch-up into quarter end that we discussed in the last Weather Report as the index surged into the end of June (performance over July and August was a lot more restrained at (+4.1%)), and it is also worth noting how different the recent performances of the equal weight SP500 and market cap weighted S&P500 have been throughout the same period.
Table 1: Performance Report
| Index/Strategy | 3m (%) | 6m (%) | YTD (%) | 1Y (%) |
| S&P 500 Index | 14.3 | 10.4 | 10.0 | 16.8 |
| S&P500 (Equal weight) | 6.8 | 5.8 | 7.7 | 8.6 |
| NASDAQ Index | 11.8 | 16.9 | 11.3 | 25.2 |
| S&P1200 Index (Global Developed Markets) | 8.1 | 9.9 | 12.9 | 14.7 |
| Smart Alpha US Large Cap Multi-Factor Strategy | 5.4 | 9.7 | 18.3 | 18.5 |
| Smart Alpha Global Large Cap Multi-Factor Strategy | 6.0 | 14.6 | 25.0 | 21.7 |
| Smart Alpha US Large Cap Value Strategy | 7.9 | 9.9 | 17.8 | 14.6 |
| Smart Alpha US Large Cap Growth Strategy | 2.8 | 7.1 | 10.4 | 11.8 |
| Smart Alpha US Mid/Large Cap Multi Factor | 9.6 | 18.0 | 22.2 | 23.7 |
| Smart Alpha US Mid/Large Cap Value Strategy | 11.0 | 17.0 | 23.1 | 20.0 |
Unlike its market cap weighted counterpart, the equal weight index has “only” grown by (+6.8% ) since the end of May and less than (+8% )YTD. This contrast highlights the impact that the so-called “Mag-7” have had on recent performance and the dominance of the themes surrounding AI that have also driven the performance of the NASDAQ over a similar period up by (+11.8%). As we noted previously, as late as June 20th (our prior rebalance) the S&P500 was flat YTD with the (equal weighted Mag-7 universe flat right through to the end of the Quarter. Those M7 stocks are now (+13%) over the last three months.
From a more global perspective, we can look at the performance of the S&P1200 developed market index which, perhaps not surprisingly given that it is the S&P 500 plus 700 “other Developed market Large cap” stock, has a similar return outlook to that of its US large cap component. This index – up (+12.9%) YTD is also becoming of more interest to investors looking to try and “diversify away from (but not by too much) US concentrated exposure in Equities with the benefit of retaining developed market levels of liquidity, governance and compliance.
“Smarts” from Smart Alpha
To build out on these headline observations, we can use a selection of the Smart Alpha strategies that we run (and publish – see https://www.libra-is.com/strategies ) to capture some of the underlying dynamics that appear to be at play. We construct these portfolios to help us access the excess returns that are available from the markets on an ongoing basis but, in doing so we are also able to gain a degree of insight as to what might be “working” at any point in time that can help shape expectations for the coming investment period.
With the Libra Smart Alpha strategies, we categorise all the stocks under coverage by “style factor” based upon our own, fundamentally derived classifications (Value, Growth, Quality, Junk etc.) using the Apollo model for expected returns. We then construct concentrated (48-stock), equal-weight, factor-based portfolios selected from the relevant underlying universes (S&P500, S&P1200 etc.) to reflect the “best” performing elements of those universes and generate excess returns.
What we can see from those portfolios ( see Table 1) is that (on an equal weighted basis) both mid and large cap (+11%) and large cap value (+7.9%) have had a strong summer when compared to growth, but whilst strongly ahead of the equal weight benchmark, still lag behind the Market Cap (Mag-7 driven headline index). This suggests that a recovery in mid cap value stocks that followed the April 2025 sell-off (captured in the 6-month performance returns) has continued alongside the more recent summer rally in mega caps. This is something that we had noted in the previous report, so it is interesting to see this continue through the rest of the summer. Much of this can be related to the resilience of the emerging technology stories (not just AI) coming through in the US but also there is a degree of geopolitics here too, with the concerns over US tariffs that prompted the April moves providing the opportunity for excess returns over the following period.
To understand how this might be working at a global level, we can dig into the top line and factor performances of our Global S&P1200 strategy. The benchmark (which includes the S&P500 stocks but adds in 700 other large Cap stocks) had recovered its YTD returns back to positive territory by the start of May and stands at (+25%) YTD in US$ terms. As always, there is something of an FX impact here, given the (-10%) YTD decline in the Trade-Weighted US Dollar (TWD) year-to-date although the TWD is basically flat since late April so we would not over state that effect. Nonetheless, this relative outperformance is an underpinning narrative for the recommendation of further diversification away from US-only exposure in equities.
Table 2: Global Factors
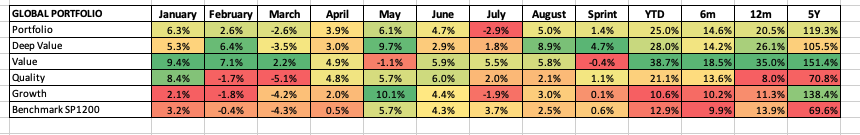
Returns by Factor
We remain big advocates of this particular global strategy. In terms of the sector drivers that we can see in Table 2, the major impact on our Global Multi–factor portfolio from the sub-portfolios that we build as part of the process has been a big factor bias towards Value (+38.7%) vs Growth (+10.6%) on the YTD measure. As a reminder, when we construct a Smart Alpha portfolio, we not only rank stocks based on our risk adjusted expected returns, but by investment factor category. This is a crucial part of the risk management process embedded within our portfolio construction. At each rebalance we construct a 48-stock equal weighted portfolio with equal investment factor exposures to the factor(s) concerned. For example, we can construct a simple “Quality portfolio” by selection from stocks that Apollo categorises as Quality or a “Value portfolio” with equal exposures to Value and Deep Value stocks. We can also construct a factor neutral portfolio ( the one shown here and in table 1) with equal exposures to Deep Value, Value, Quality and Growth ( with zero exposure to Junk or other high risk categories) This ensures that there is no unintended or persistent factor bias embedded in the portfolios.
Digging into this further, the outperformance of Value was NOT just because of the sell -off/recovery after April but because of the Value outperformance in January and February that simply saw returns compounding to the sub portfolio throughout the following period. What is also worth noting is how, in February, May and August, the Deep Value sub- portfolio has had strong monthly outperformances, leaving it, YTD as the second strongest contributor to overall returns. Interestingly, Quality – often the by-word for growth at a reasonable price has remained something of a bystander for global returns over not only 2025, but in terms of longer-term returns, appears to have become far less of a source of excess return too.
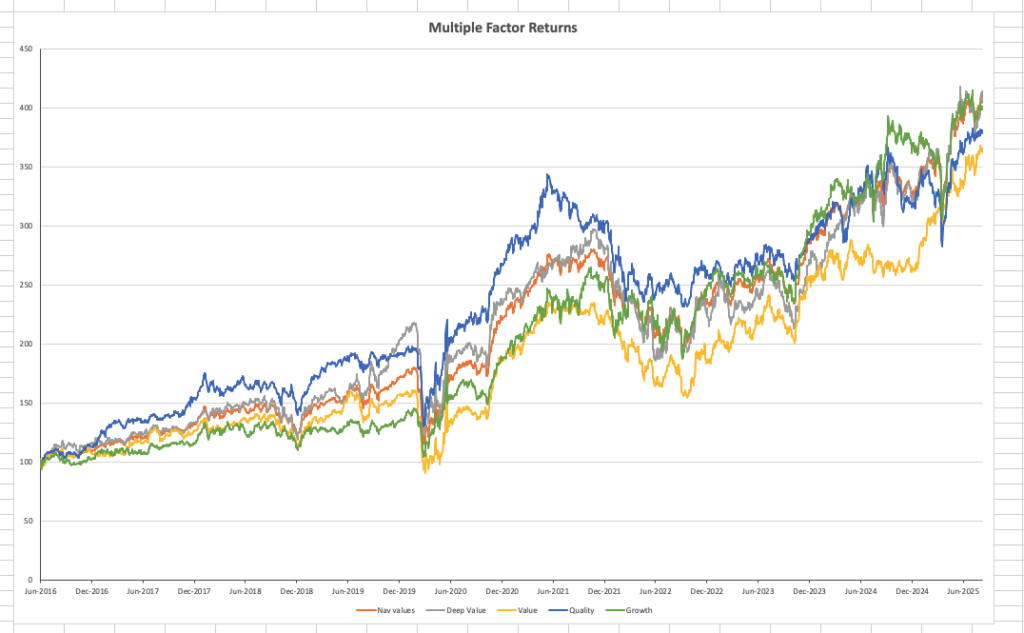
The longer-term compounding portfolio and sub portfolio NAV chart shown in Chart 1 illustrate this point well. Partly because of the disruptions in 2020, the 5-year return numbers can be a little misleading. Quality – the dominant (blue line) from 2016 onwards remains aligned with both the total portfolio (orange) and ahead of value (yellow) over the total period despite “only” matching the benchmark on the 5-year return measure and being less than half the return to Value shown in Table 2. Note too, that Quality, Deep Value and Growth all took a hit in April 2025 before bouncing back strongly but, for Quality, this followed a poor February and March; suggesting that the declining sentiment towards the Global Tech sector in general that started to emerge in Q1 was impacting relatively early on Quality names too.
Chart 1: Compounding returns
Back to work
It appears that the summer period has been a combination of catch-up and consolidation for equity markets and, for the Apollo Strategies, the fact that, for the last three months, growth has been at an annualised rate in the mid to high 20% range, reinforces the message about building on firm foundations and compounding through time.
With all that said, the end of the summer (traditionally marked by the US Labor Day holiday) (and hence the start of Autumn) also marks the start of what is often one of the trickier periods of the year for markets. In the US markets in particular, September has a history of being the poorest month in performance terms and the run into the Q3 Reporting season in early October has a reputation for higher-than-normal levels of market volatility as we get a first look at C-Suite thoughts for the (calendar) year ahead. Stock selections based upon intangible valuations are particularly prone to over reaction in such periods and there is clearly a wider sense relating to AI related narratives in particular, that delivery – not just ambition – is now the focus.
This makes the period of our current Sprint (Mid-August to mid-October) a challenging one. Not only one that is prone to increased uncertainty around such a major thematic of the last eighteen months as AI, but also one where the persistent clamouring for justification for deployment to equities in general is in full cry– especially when the markets as a whole do not appear to be driven by the kind of strong underlying fundamentals that current valuation levels might suggest.
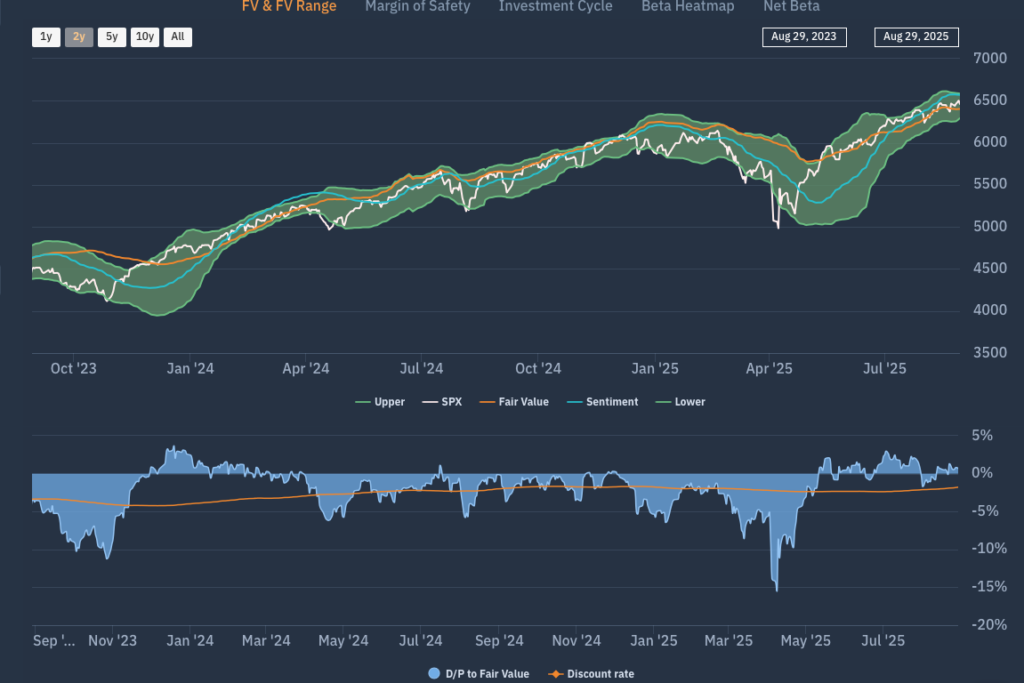
Yet this doesn’t make us fear a dramatic correction. We do see periods of “boom and bust” in Equity markets – especially in thematic ideas and alongside periods of ultra-hyped sectoral plays (Robotics, Clean Energy, AI, Defence etc.). However, markets can-and do – operate under extended periods of consolidation in the wake of high drama and this (currently ) appears to be one. As Chart 2 shows, the outlook for the S&P500 through the eyes of the Apollo system is one where the Apollo measure of FV (orange line) is now trending sideways, alongside the Apollo measure of sentiment (blue line) which, over the last ten days, has also flattened out. The trading range associated with this – the FV range is also trending sideways, and it will be important to note if the width of this range now starts to widen out as this tends to presage an uptick in uncertainty and an increase in price volatility under somewhat directionless market conditions.
Conclusions – some Autumnal storms to weather
After a summer that has been largely uneventful (albeit against a background of improving sentiment towards equities), we enter the Autumn with relatively little stress in markets (and I knowingly include Fed speculation and unpriced geopolitical risk in this). This suggests that it will be events and announcements – largely on their own merits – that the market will be reacting to – as opposed to ex-post responses to any over anticipation or misplaced optimism that the market may be carrying forward as a whole. A 12-month expected return for the S&P500 of 9% on our numbers is still a supportive returns environment for investors but, after the dramas of the Spring, investors may be forgiven for looking to this next period (basically now until Thanksgiving) as the limit of time for delivery on “promises made” by the corporate sector. There may be some high-profile fireworks at the individual stock level as we head into October and trading ranges may expand somewhat, implying rising overall levels of uncertainty. To return to our maritime analogy, we are heading for some stormier weather – that is for sure – as the corporate “Winds” pick up, but the general pattern of the currents and tides of valuation and momentum do not appear, for now at least, to be too affected by them. For investors that means that there is work to do in terms of managing their portfolios and paying particular attention to changing risks at the stock level, but that is what “Autumn sailing season” is all about.