
Cruising to Antarctica

We call our regular Apollo based commentary “The Weather report”. The analogies that we can make with the multiple elements of Value, Momentum and Uncertainty impacting markets in a continuous way chimes nicely with the idea of Currents, Tides and Winds, all impacting the navigation of the high seas. Whatever the nature of the vessel concerned or the skills, experience and capabilities of the crew, the Maritime Weather Report is an essential part of the information system that is required and so the Market Weather Report is designed to perform a similar, essential function.
With the first calendar month of 2026 now behind us, a casual observer of the market numbers might think that, with the S&P500 up by 1.4% and the NASDAQ Composite up by around 1% YTD, the Tech heavy NASDAQ100 also up by 1% but the (equal weighted) Mag-7 flat YTD, we were in more cautious ( with respect to the AI story and the Mag 7) but relatively normal – even benign – market conditions, despite the geopolitical backdrop and what looks to have been a rather turbulent month end trading session for the Tech sector. The old Wall Street maxim of “…so goes January so goes the year” might bode reasonably well on that basis but look a little deeper and beneath the surface things are far from normal.
The equal weight S&P500 was up by (+3.3%) in January marking another month whereby the mega caps appear to be acting as a drag to large cap returns. At the other extreme a 8.5% surge in Russell 2000 (small caps) by mid-month before closing at (+4.2%) suggests a size rotation might also be in the background. From a geographical perspective, non-US markets raced away from the starting line. A strong Europe caught many investors attention with the SXXP developed Europe benchmark up (+3.1%) in January and by (+4.8%) in US$ terms given the weakening currency. The weaker US$ also boosted Emerging Market Equities returns in US$ terms with GEM stocks up nearly (+11%) before closing out at (+9%), YTD, booming precious metals and commodity prices (silver +38% YTD – but down 13% in a day), Gold up (+25%) by mid-month before closing down 8% on the last day of the month, Copper futures up 5% YTD, Oil prices (+12%) before collapsing back to (+4%) YTD the trade weighted US$ down (-1%) but the US$/Yen approaching 160 and under pressure last week amidst rumours of official intervention. Headline changes at the Fed, talk of US Government shutdowns and a flurry of AI related news flow once again raising the question of Capex costs, Cap raising requirements and poor visibility of profitability.
The point is not so much to identify why some of these events might be taking place – a diversification away from US dollar assets ( and therefore the currency) at the start of the year is one theory, a shift to real world commodity plays (raw materials and Energy) as the longer-term winners from AI Capex is another, but to recognise that alongside these different factors, broader market risks are building, not subsiding.
With so many seemingly market-related actions occurring – changing asset allocations, new, structural views being expressed towards investment themes and trends etc. it is precisely the point that externalities can have the most unexpected impacts. When multiple elements appear to be occurring simultaneously but leaving a directionally “normal” market, the risks of geopolitical escalation that are also present raise the prospect of counteractions that may end up significantly more dramatic – the “all events correlate to minus-1” scenario similar to the shocks of last April with US Tariffs or early 2022 when the gradual unwinding of zero interest rates led to a collapse in leveraged markets. After Venezuela, the Greenland sagas of Davos and the Armada sailing towards the Gulf, it is clear that external risk factors should not be ruled out not only for their own impacts but for the potential to unbalance the shifting themes below the surface.
Baffled by beta
Part of the problem investors face is that, whilst listed equities continue to form the core part of what are described in relative terms as “risk assets” there is little to no actual risk management being put in place across the asset class. This is particularly so with the explosion in “passive investing” and what has become recognised as the “SPY” problem: the headline ETF that replicates the S&P500 index is all too frequently treated as a singular asset that “fairly represents” the risk-adjusted return to equities in general. In this sense, large Cap S&P500 is “The Market” and that an exposure to equities via tracker funds or ETF’s is the easy and straightforward (and only?) way to put investments in place.
Yet as we see in the top two lines of Table 1, there’s more than one way to capture “The Market.” The drag on performance that the market cap approach to investing in the S&P500 generated as opposed to the equal weight approach (+1.7% vs +5.3%) highlights the question of what exactly is the expected return – the beta of “The Market” – over time? If the returns to the same group of stocks is actually a function of stock weightings, then what should those weightings seek to achieve if, by varying them you gain or lose the de-facto risk adjusted returns you are assuming? If the long run expected returns to the US Equity market are around 10% per annum what would appear to be excess returns attributed to passive exposure to a benchmark – then (+23%) return in 2024 for example be down to? Is that risk or is that somehow also “beta?”
On a cruise – is not the same as the real thing
When markets start to perform “more normally”, and recent fears appear to abate is exactly the time to be careful and is when risk management needs to match against potential reward Yet risk is not something to pretend away simply because it is somehow universally shared (and therefore both costs and benefits assumed to be unavoidable). In the same way that you can now replace one of the most risky of adventure holidays – 5 days strapped into a converted fishing trawler across the most dangerous stretch of water on earth (Drake’s passage) to see the Antarctic wilderness – with a 5-star cruise liner to meet up with a penguin without getting your hair wet, the risks don’t disappear just because of the size of the ship or the number of passengers on board. A cruise to the Antarctic doesn’t have zero risk – but then even a modest swell is going to prompt caution from the Captain, and you might just have to watch the seals and whales through the windows of the air conditioned lounge bar as opposed to the lenses of your snow goggles. After all, you can always come on another cruise…
Such is the challenge of risk-taking in risky markets – but is difficult to achieve without proper risk management. Making access to high(ish) risk and matching reward is what risk management should be about but is simply not achievable under a passive investment framework. It may have worked for a while now, but what is already becoming apparent this year is that active – not passive – stock selection is going to play a significant role in returns. The hyperbole around the Mag-7 and the birth pains of the AI revolution are not going to be universally eased by time. As the divergent performances of the Mag-7 are already demonstrating, not all hyperscalers will be treated equally by the markets this year. After years of collective tech industry expansion, AI is shaping up to be the catalyst for the world’s largest Tech businesses to become not just competitors but genuine rivals in the same arena. They can’t all be winners and so the fact that we are already seeing the impact of this drag on the headline index – the Market Cap weighted S&P500 Index is up by 1.4% YTD, but the equal weight index is up by close to 3% – is an indication of how not only stock selection but position weightings may become a clearer differentiator of returns.
Review of Performance – under the surface
As has become the norm for the Weather Report, we can take a closer look at some of the recent performances of the main market indices through the lens of the Apollo strategy models (price performances are to index close values from 30 January 2026). The 6-month returns in Table 1 take us back to the August whilst the 3-month number taking us back to the start of November – capturing the October year end for many US Mutual funds who may have locked in their tax loss harvesting before December distributions and reinvestment takes place.
Table 1: Performance Report (price returns %)
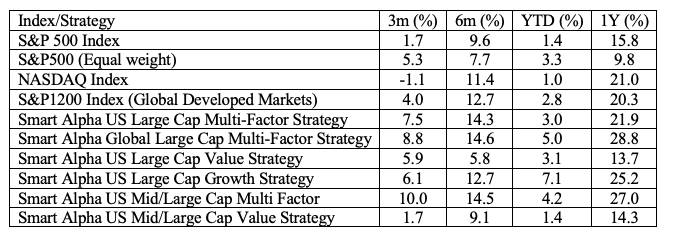
The divergent returns of the S&P500 equal weight and market cap weighted indices continues to be a story for the markets, but the narrative has now flipped. Far from being an indication of how important exposure to mega caps are to returns from “The Market” this divergence now reminds investors that the structural differences involved in the makeup of “The Market” benchmark and the ongoing Mag-7 story which is the S&P500 (market cap weighted) story can work in reverse. The penny would appear to have dropped that the Mag-7 have gone from being a highly correlated thematic investment theme that throws off excess returns – easily played out via a long only exposure to the SPY – to a set of high-profile mega-caps that are not only no longer directionally correlated but are beginning to actively “eat each other’s lunch” as co-operation turns into competition across the AI capital investment landscape. The latest announcements from Oracle reinforce the reality that the AI story is shifting towards significant long term capital expenditure and capital raising – not share buy backs and excess distribution of free cashflows.
From a more global perspective, we typically look at the performance of the S&P1200 developed market index (the S&P 500 plus 700 “other Developed market Large cap” stocks). This benchmark has 3 and 6-month performances that now capture some of that US$ weakness related upside seen in across the non-US$ markets (albeit handicapped by the still dominant mega/large Cap (S&P500) index which accounts for around 2/3rds of the index). A (+2.8%) return in January is undoubtedly a good start to the year for global equities but as the trend towards diversification away from pure US exposure and (perhaps) away from such an exposure to US Tech and Mega Caps in particular continues, it is likely that investors will need to also migrate away from headline benchmarks and drill down further into global markets as the year progresses.
“Smarts” from Smart Alpha
We can use a selection of the Smart Alpha strategies that we run (and publish – see https://www.libra-is.com/strategies ) to capture some of the underlying dynamics that appear to be at play. We construct these portfolios to help us access the excess returns that are available from the markets on an ongoing basis but, in doing so we are also able to gain a degree of insight as to what might be “working” at any point in time that can help shape expectations for the coming investment period.
With the Libra Smart Alpha strategies, we categorise all the stocks under coverage by “style factor” based upon our own, fundamentally derived classifications (Value, Growth, Quality, Junk etc.) using the Apollo model for expected returns. We then construct concentrated (48-stock), equal-weight, factor-based portfolios selected from the relevant underlying universes (S&P500, S&P1200 etc.) to reflect the “best” performing elements of those universes and generate excess returns.
What we can see from those portfolios (see Table 1) is that on a six-month basis (on an equal-weighted basis) the difference between US mid and large cap (+9.1%) and US large cap value (+5.8%) continues to normalise but remains a point of difference for value investors. What is being captured here is that, after a disappointing late summer period, large cap value has seen clear (relative) recovery over the last 3 months and is now catching up with large cap growth as a “factor performer” For the last 12 months, Apollo Smart Alpha multi-factor US large cap (48 stocks equal weighted) is up by 21.9% – a dramatic premium over the equal weighted benchmark (+9.8%) and also the S&P500 benchmark.
Looking at this from a broader, global level, we can dig into the top line and factor performances of our Global S&P1200 Smart Alpha strategy for further insight. Perhaps not surprisingly given the importance of the Large Cap US tech stocks in the global benchmark, the 12-month performance (+20.3%) in US$ terms is in line with the NASDAQ (+21%) but notably well ahead of the S&P500 benchmark. (+15.85). However, the strong 12-month performance (+28.8%) of the Smart Alpha strategy version based upon this universe has been a steady, building performance -generating a steady excess return over the rest of the year with only one negative month (July).
Risk (and returns) by Factor
Drilling down to the factor level, when we construct a Smart Alpha portfolio, we not only rank stocks based on our risk adjusted expected returns, but by investment factor category. This is a crucial part of the risk management process embedded within our portfolio construction. At each rebalance we construct a 48-stock equal weighted portfolio with equal investment factor exposures to the factor(s) concerned. For example, we can construct a simple “Quality portfolio” by selection from stocks that Apollo categorises as Quality or a “Value portfolio” with equal exposures to Value and Deep Value stocks. We can also construct a factor neutral portfolio ( the one shown here and in table 1) with equal exposures to Deep Value, Value, Quality and Growth (with zero exposure to Junk or other high-risk categories) This ensures that there is no unintended or persistent factor bias embedded in the portfolios.
This approach continues to pay dividends. In terms of the sector drivers that we can see in Table 2, the differentiated drivers of the Global Multi–factor portfolio from the sub-portfolios in 2025 has been from Deep Value (+40%) and Value (+32.5%) compared to Quality (+21.1%) vs Growth (+20.8%). However, it is Deep Value and Growth that have accelerated over the last six months with Growth surging in January (+9%).
Table 2: Global Factors
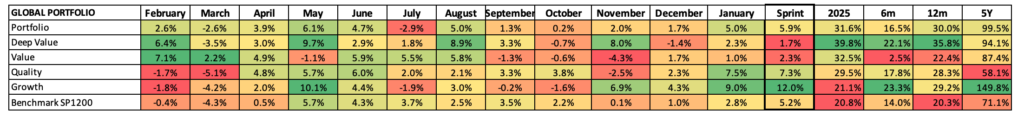
If we contextualise this over slightly longer time frames, the last six months saw the overall Smart Alpha portfolio up ahead of the benchmark (16.5% vs. 14%) and for 2025 as a whole (+31.6% vs. +20.8%). It demonstrates a similar outperformance on a one-year basis (+30% vs. +20.3%); with only Value lagging the other three (+22.4%).
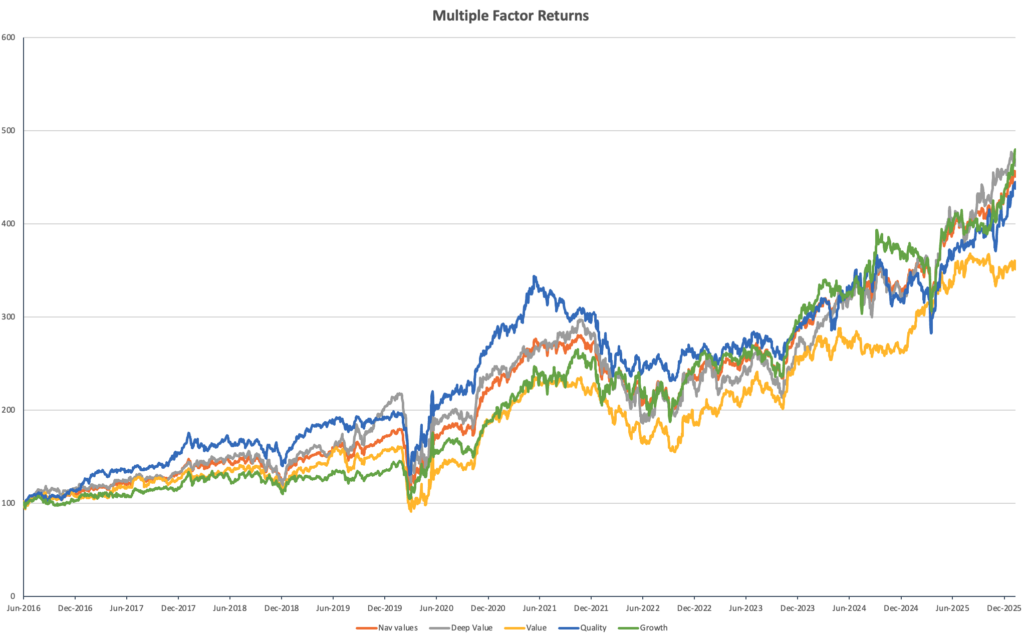
The longer-term compounding portfolio and sub portfolio NAV chart shown in Chart 1 highlights how the factor outlooks have diverged not only recently but over the longer term. The disruptions in 2020 continue to leave the 5-year return numbers a little misleading at the headline level but visually Quality – the dominant (blue line) from 2016 onwards remains aligned with both the total portfolio (orange) and clearly ahead of value (yellow) over the total period with Growth a clear compounding winner over longer horizons and, alongside Deep Value the dominating factors of late. Meanwhile, the sharp drop off in relative performance of Value is thrown into sharp relief in the chart.
Chart 1: Compounding returns
Weather Forecast – Macro currents
We rounded off last year with a discussion of global prospects for the year ahead and noted that currency related issues with respect to a weakening of the US$ would probably form the basis of ongoing conversations about diversification away from US$ exposures by both US and international investors and how that could shape capital flows in the first half of 2026. Evidence of further international flows out of US Treasuries for example and an increase in exposure to relatively underweight asset groups such as Global (ex US) and EM equity universes could indicate something of a shift in the structure of the current “bull market” – a maturing if you will – based upon the internal dynamics of market risk appetite and perceived investment returns.
To the extent to which this has already started to happen (and had in fact begun to emerge as 2026 themes before year end) this hardly looks to be a ground-breaking insight, but what we should also acknowledge is that the catalysts for some of these moves may not be simply internal market ones. Whilst AI has dominated the US market headlines for the last twelve months, it is very clearly a global as opposed to just a US investment story. Tariffs are also an investment theme that has both global and US winners and losers – both now and going forward. Beyond this, “traditional macro” is clearly at work as even a month ago, an abduction of the Venezuelan president, a Trump “truth bombing” of Davos – and the emergence of Greenland as a major geopolitical issue alongside it – were not on many market bingo cards. And that is before the WTI rollercoaster from the Armada to Iran or the peace-no-peace in Ukraine is taken into account.
What we would continue to say (and perhaps not surprisingly given our stock selection approach to portfolio construction) is that when it comes to risk diversification with respect to either investment themes or macro issues, it is rarely a pure country play. Of course, a jump in Brazilian mining and raw materials stocks in January can be seen as play on Brazil, but in reality reflects a global commodity demand shift that sees (London listed) Global miner Rio Tino up (+16%) in January or (London Listed) Fresnillo up by (+138%) over three months on the basis of its Mexican silver operations before falling (-18% ) in a week as precious metals (and in particular silver) corrected in price. Similarly, the strong performance of the AMX in Holland was effectively one stock – ASML – whilst the KOSPI rally in January (+ 24%) is really ”just” Samsung Electronics and SK Hynix.
These Global AI and Resources plays reinforce the view that we do not see the need to split the world into US vs non-US exposures but can sensibly – on an equal weighted basis – manage exposure to all developed market assets on a stock selection basis and can then play out themes or macro ideas on a global landscape. What we do find useful though, is to use the US market framework to identify how Factoral dynamics, investment themes and macro ideas are emerging before perhaps playing those out on a wider stage.
Returning to our familiar nautical (financial) themes of Currents (value), Tides (momentum), and Winds (uncertainty) we note that 2025 was not a year for persistent factor performance at either a US or a global level and attempts to follow a persistent factor path have been disappointing. Value surged – then faded. Momentum reversed and then stalled. Growth rebounded, retreated, and finally surged into year end. Currents, tides, and winds all combined to push markets persistently away from expectations, and rewards did not really appear aligned with risk – until late December when the emergent patterns we have seen so far in 2026 began to form.
Growth, it would seem, is on the radar screens of investors and, on this basis, what is also looking more realistic is the maturing of the AI story of 2025 with a focus upon what may be growing now – in 2026/2027 as opposed to potential growth in 2030 and beyond. Much of the flows into real assets has been a reflection of the Energy and Raw material requirements that the major capex requirements of the AI story point to and the realisation that the likes of Samsung, ASML and Hynix are just as capable of being the big winners than any of the Mag-7 or their close associates.
The S&P bellwether
If we take a look at the Apollo market chart for the (market Cap weighted) S&P500 shown in chart 2: below, we can see the positive sentiment impact that the current reporting season is having on both growth expectations (a steepening of the orange fair value line) and sentiment (the blue line). As these trends fed through into the data within the Apollo system the US market moved in January (mid-month) to being rated as a growth market and momentum built throughout the second half of the month. The width of the FV range is narrowing once again somewhat similar to the Q4 2022/Q1 2023 as (positive) directional sentiment starts to emerge.
Moving down a level, we can look at whether there are any sector level dynamics now emerging that can be used to read across to other markets.
Chart 2: Apollo FV range for S&P500
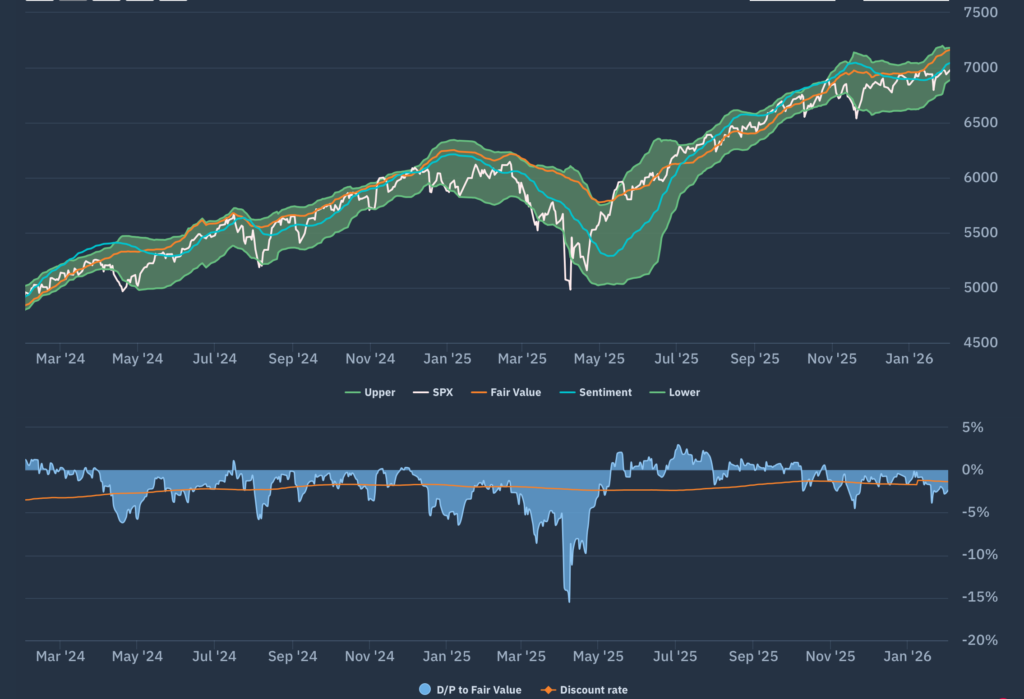
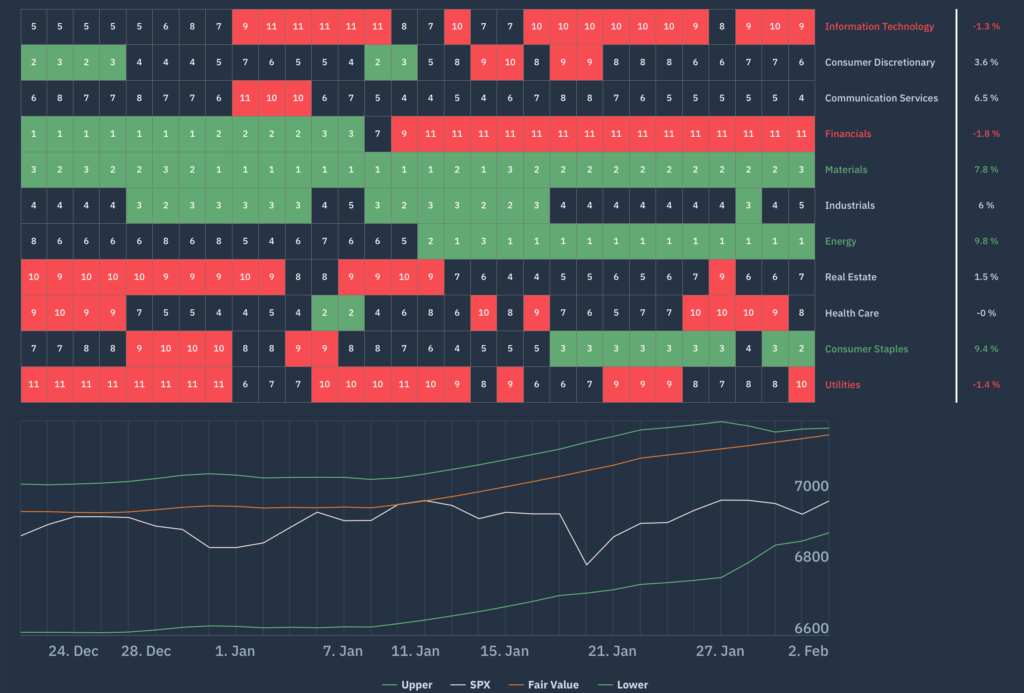
Chart 3 is the Apollo chart thar we use for this. This is the Apollo beta heatmap for the S&P500 that shows the relative sector rankings in terms of rolling 1-month returns across the main US S&P500 market sectors, ranked by relative market beta from high beta (cyclical sectors) down to low Beta (defensive sectors).
We can see that Tech has remained weak, taking a back seat to Energy, Materials, and Industrials. Note too, the rotation away from Financials mid-month and the continued underperformance of defensives such as Utilities and healthcare over the last month even as broader equity market sentiment has rallied. From an Apollo perspective, this broadly beta-neutral performance of the market by sector (i.e., not driven by extremes of relative beta) remains “net beta neutral” and fairly typical of how most calendar years start. However, it remains a “Macro indicator” we keep an eye on as earnings reports begin to feed through and sectors like consumer discretionary start to attract attention.
Chart 3: Apollo S&P500 Sector Heatmap
Forecasts and conclusions
So much of the perceived investor appetite towards equities is US-centric that it appears almost shocking to see other markets gaining attention. There was certainly a time when the relative growth story in Europe or Asia was seen as a driver of long-term returns for those wishing to diversify (mainly on a value basis) but the dominance of growth in the US and of Tech in particular has left much of global equity markets on the (relative) side-lines.
The fact that this started to change towards the end of last year at the same time as the AI Hype story was beginning to be challenged is probably no coincidence. The idea that AI could only be invested in via a handful of hyperscalers has been dismissed (probably for good) at the same time that fantastical return forecasts for some point in the future have been replaced by a more realistic focus upon actual deliverable revenues in 2026. Stellar results from the likes of ASML, Samsung Electronics and SK Hynix in Korea confirms how rapidly these benefits are emerging amongst international businesses and prices have responded accordingly.
It’s early days, but equity growth – globally is likely to be the story of H1. We are now into the Q4 reporting season but there is a lot of news flow to come in the coming weeks so reward for growth ( and punishment for absence of growth) may well become a short-term theme into the end of February and early March.
Elsewhere, as investors look at real world assets and global patterns of demand for them, the energy and mining sectors across the globe are unlikely to lose their shine for investors. Currency factors will also emerge as influences on investor returns but with these being driven more by macro realities than investor sentiment, it is unlikely that the general themes of technology and innovation – still predominantly found in US listed companies are likely to be sliding very far down the risk appetite list. Diversification – such as we might see away from US markets is likely to be limited to expanding stock level exposures – such as they exist – to these themes in the way that we have already seen in North Asian markets in particular.