

Seasonal tailwinds begin
We call our regular Apollo based commentary “The Weather report”. The analogies that we can make with the multiple elements of Value, Momentum and Uncertainty impacting markets in a continuous way chimes nicely with the idea of Currents, Tides and Winds, all impacting the navigation of the high seas. Whatever the nature of the vessel concerned or the skills, experience and capabilities of the crew, the Maritime Weather Report is an essential part of the information system that is required and so the Market Weather Report is designed to perform a similar, essential function.
Do traditional market patterns still matter in the age of AI and the 2025 surge in retail investor flows? As market players returned after Labor Day to review what had been a strong summer rally, much was made of the seasonality of September being a traditionally “poor month” for markets. Although perhaps not the same phenomenon as we used to see when US Mutual Funds indulged in tax loss management ahead of September fiscal year ends, the average September monthly return for the US market was still (-1%) – and a clear outlier month across the calendar. Yet as we noted last month, that was very much NOT the case this year with the (+3.5%) performance of the S&P500 and (+3.0%) increase in the Russell 2000 putting lie to that theory. (Having said that, the fact that the equal weighted S&P 500 was only up (+0.9%) in September does suggest that the mega-cap influence of the US Tech Giants has clearly continued its distortive influence.)
The run into “Scary October” as the Q3 reporting season hit its stride and the market awaited the AI narrative messaging from the US Tech giants posed a similar narrative overhang at the start of the month, but, yet again reality has proven to be somewhat different. October ended with a credible (+2.3%) performance for the S&P500, and (+1.7 for the Russell 2000) -although the Equal weight S&P500 was down (-0.9%) in October. Meanwhile the M7 outperformed once again – (+4.8%) on an equal weight basis after what Citadel Securities refer to as the “Super Bowl of the Earnings season now passed (40% of the S&P500 including 5 out of 7 of the Mag Seven reported last week) saw them meeting and (mostly) exceeding expectations.
Do we have a tail wind in our sails?
So, as November markets begin and we move into what is often considered the strongest part of the calendar as a choppy October gives way to strong tail winds into year end, after the failure of both September’s and October’s history lessons, can we expect these seasonal tail Winds to still deliver? Q3’s results have certainly been above expectations (so far over 80% of S&P500 results are above forecasts) and even though we have witnessed a fair degree of institutional scepticism being expressed towards markets – particularly around the AI story, retail investors, in particular, have remained engaged. With last week’s M7 indigestion now out of the way and with the reality of the latest Fed rate cut and commitment to ending QT now offsetting the algo-led disappointment about the potential lack of a December move, market volatility has backed off once again. The VIX spike of mid-October – a result of the one-day US Trade related October 10th (-2.4%) drawdown was enough to force mechanical deleveraging of vol traders, but with the VIX back to the levels we started at in October (16.8) and comfortably below the “low fear” threshold of 20) we may well see a return of these recently side-lined investors.
Review of Performance – did April ever happen?
As has become the norm for the Weather Report, we can take a closer look at some of the recent performances of the main market indices. With the 6-month return now fully reflecting the post Liberation Day rally – the US market at the start of May was at essentially the same level as at the start of April making it almost as if “April never happened”.
Table 1: Performance Report
| Index/Strategy | 3m (%) | 6m (%) | YTD (%) | 1Y (%) |
| S&P 500 Index | 7.9 | 22.8 | 16.3 | 19.9 |
| S&P500 (Equal weight) | 2.4 | 9.7 | 7.5 | 6.4 |
| NASDAQ Index | 12.2 | 33.0 | 23.0 | 30.5 |
| S&P1200 Index (Global Developed Markets) | 8.4 | 21.0 | 19.4 | 20.8 |
| Smart Alpha US Large Cap Multi-Factor Strategy | 7.8 | 17.3 | 22.6 | 20.5 |
| Smart Alpha Global Large Cap Multi-Factor Strategy | 6.6 | 15.0 | 26.9 | 23.7 |
| Smart Alpha US Large Cap Value Strategy | 1.9 | 7.3 | 13.7 | 12.9 |
| Smart Alpha US Large Cap Growth Strategy | 8.1 | 18.0 | 17.4 | 16.4 |
| Smart Alpha US Mid/Large Cap Multi Factor | 6.9 | 26.3 | 24.3 | 20.0 |
| Smart Alpha US Mid/Large Cap Value Strategy | 6.8 | 25.9 | 25.4 | 21.4 |
The divergence in performance between the headline S&P500 market cap weighted index and its equal weight counterpart continues to unnerve investors, given the dominant Mag 7 story. The headline Index (+16.3%) vs. the equal weight index (+7.5%) YTD reflects the dominance of the themes surrounding AI (AI is estimated to account for around 80% of total US Equity returns YTD) that have also driven the performance of the NASDAQ over a similar period up by (+23%) with much of this occurring only since mid-year. Compare the one-year performances and the case is even starker (S&P 500 (+20%), S&P500 Equal weight (+6%) and NASDAQ (+31%).
From a more global perspective, we can look at the performance of the S&P1200 developed market index (the S&P 500 plus 700 “other Developed market Large cap” stocks). This benchmark has a YTD return that sits between that of the S&P500 and that of the NASDAQ; up (+19%) YTD in US$ terms. The global focus is continuing to promote interest to investors looking to try and “diversify away from (but not by too much) US concentrated exposure in Equities with the benefit of retaining developed market levels of liquidity, governance and compliance.
“Smarts” from Smart Alpha
To build out on these headline observations, we can use a selection of the Smart Alpha strategies that we run (and publish – see https://www.libra-is.com/strategies ) to capture some of the underlying dynamics that appear to be at play. We construct these portfolios to help us access the excess returns that are available from the markets on an ongoing basis but, in doing so we are also able to gain a degree of insight as to what might be “working” at any point in time that can help shape expectations for the coming investment period.
With the Libra Smart Alpha strategies, we categorise all the stocks under coverage by “style factor” based upon our own, fundamentally derived classifications (Value, Growth, Quality, Junk etc.) using the Apollo model for expected returns. We then construct concentrated (48-stock), equal-weight, factor-based portfolios selected from the relevant underlying universes (S&P500, S&P1200 etc.) to reflect the “best” performing elements of those universes and generate excess returns.
What we can see from those portfolios (see Table 1) is that (on an equal-weighted basis) both mid and large cap (+26.3%) and large cap value (+25.9%) have had a significant – and persistent recovery over the last six months. Whilst this is against the backdrop of the (Equal weighted) Mag 7 running up 47.8% over the same period, the YTD performances of (+24.3%), (+25.4%) and (+23.4%) respectively perhaps provide a better comparison, reflecting the far higher level of volatility of the Mag 7 over the course of the year.
It seems that the recovery in mid cap value stocks that followed the April 2025 sell-off has continued alongside the more recent summer rally in mega caps. This is being helped by a broadening out of the dominant AI theme beyond the Mag 7 and the resilience of the emerging technology stories (not just AI) coming through in the US as the longer term “reshoring” theme for US companies develops.
Looking at this from a broader, global level, we can dig into the top line and factor performances of our Global S&P1200 Smart Alpha strategy for further insight. The benchmark (which includes the S&P500 stocks but adds in 700 other large Cap stocks) showed an earlier recovery than the US benchmarks in the wake of April’s declines and was back in positive YTD territory by May. As noted above, the Benchmark currently stands at (+19%) YTD in US$ terms. Our Smart Alpha strategy based upon this benchmark rode out the April sell off very quickly. It helped that, unlike its benchmark (or the US benchmarks) it entered April in positive YTD Territory (+7.4%) and was back in positive return territory within a week. As a result, its YTD performance ( +27%) reflects the kind of stable, persistent return throughout 2025 that is consistent with that Q1 performance. Also worth noting is that as the US$ stabilises after the selloff seen earlier in the year, the FX impact is declining with the (-6%) YTD decline in the Trade-Weighted US Dollar (TWD) and (-3%) on a twelve-month basis no longer driving a significant currency effect on returns. That said, an increasing investor focus upon US$ exposure persists, so the outperformance of the Global developed market outperformance is an underpinning narrative for the recommendation of further diversification away from US-only exposure in equities (just not by too much).
Risk (and returns) by Factor
We remain big advocates of this strategic approach. In terms of the sector drivers that we can see in Table 2, the major impact on our Global Multi–factor portfolio from the sub-portfolios that we build as part of the process has been a big factor bias towards Value (+36.1%) and Deep Value (+31.3%) and Quality (+29.8%) vs Growth (+8.6%) on the YTD measure. As a reminder, when we construct a Smart Alpha portfolio, we not only rank stocks based on our risk adjusted expected returns, but by investment factor category. This is a crucial part of the risk management process embedded within our portfolio construction. At each rebalance we construct a 48-stock equal weighted portfolio with equal investment factor exposures to the factor(s) concerned. For example, we can construct a simple “Quality portfolio” by selection from stocks that Apollo categorises as Quality or a “Value portfolio” with equal exposures to Value and Deep Value stocks. We can also construct a factor neutral portfolio ( the one shown here and in table 1) with equal exposures to Deep Value, Value, Quality and Growth (with zero exposure to Junk or other high-risk categories) This ensures that there is no unintended or persistent factor bias embedded in the portfolios.
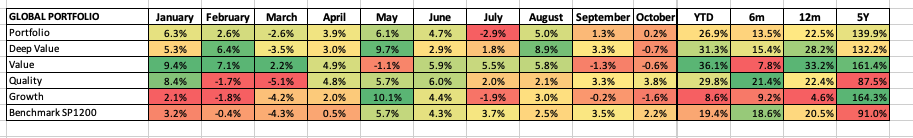
What is interesting about how this Factor mix has evolved since the summer is that, aside from a Deep Value surge in August, it is Quality that has carried the day (now (+21%) over the last six months. As we often note, Value and Deep Value can have sharp periods of outperformance in the light of high-profile market selloffs whilst Growth and Value, on our Factor neutral approach end up with very similar long term returns but with very different trajectories. Quality tends to be more stable and comes through the middle.
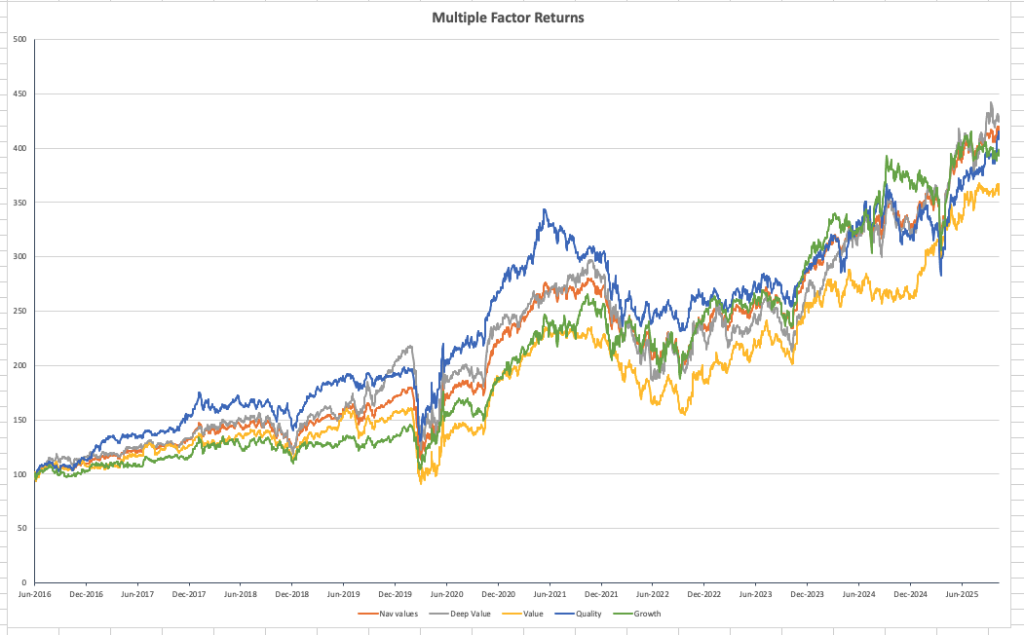
The longer-term compounding portfolio and sub portfolio NAV chart shown in Chart 1 illustrate this point well. Partly because of the disruptions in 2020, the 5-year return numbers can be a little misleading. Quality – the dominant (blue line) from 2016 onwards remains aligned with both the total portfolio (orange) and ahead of value (yellow) over the total period despite “only” matching the benchmark on the 5-year return measure and being around half the return to Value shown in Table 2. Note too, that Quality, Deep Value and Growth all took a hit in April 2025 before bouncing back strongly but, for Quality, this followed a poor February and March; suggesting that the declining sentiment towards the Global Tech sector in general that started to emerge in Q1 was impacting relatively early on Quality names too and its more recent out performance captures that recovery.
Weather Forecast – Enjoy the winds at your back
To return to our familiar nautical (financial) themes of Currents (value), Tides (momentum), and Winds (uncertainty), the question now raised is whether sufficient “winds (in the form of an improvement in relative certainty) is now emerging to a sufficient degree to drive markets higher into 2026. The general market mood of the last few months and the factor backdrop outlined above would suggest so. As institutional investors moved to the side lines and became more cautious over declining momentum and what were perceived to be stretched valuations, retail investors remained engaged. US retail volumes ended October at multi-year highs, along with record high levels of retail call options being bought. With the Q3 reporting season now largely behind us but leaving a strongly supportive tone and the re-emergence of corporate buyback activity emerging after the Q3 reporting season (over $1 Trillion of buyback authorisations have been granted to S&P500 companies YTD) an improvement in institutional sentiment in line with that of retail seems credible. November and December are typically the major period for buybacks to take place so CTA’s and trading funds who have been de-leveraging in recent weeks will be looking for both volume and vol signals to guide their positioning into year end. A key trading sentiment indicator – the AAll Bull-Bear spread – has just returned to positive sentiment and with CTA’s anticipated to have remained long US equities into October month-end there could be a fair degree of market activity occurring into the start of November.
The Apollo market chart for the S&P500 shown in chart 2 below helps to add context to this. The narrowing of the FV range that had been a feature of the late summer period had looked to stall as we came to late September, and last month we voiced concern that this may start to widen if uncertainty resurfaced. However, as we enter November, the narrowing of the range appears to have resumed, suggesting an improvement in risk appetite alongside the index trading towards the top end of a generally rising trading band. Our proprietary measure of sentiment (the blue line) highlights the persistent strength of the US market trend that picked up in early September, and with the Apollo measure of Value also trending higher the positive tail winds of sentiment seem to come with supportive tides and currents of momentum and value.
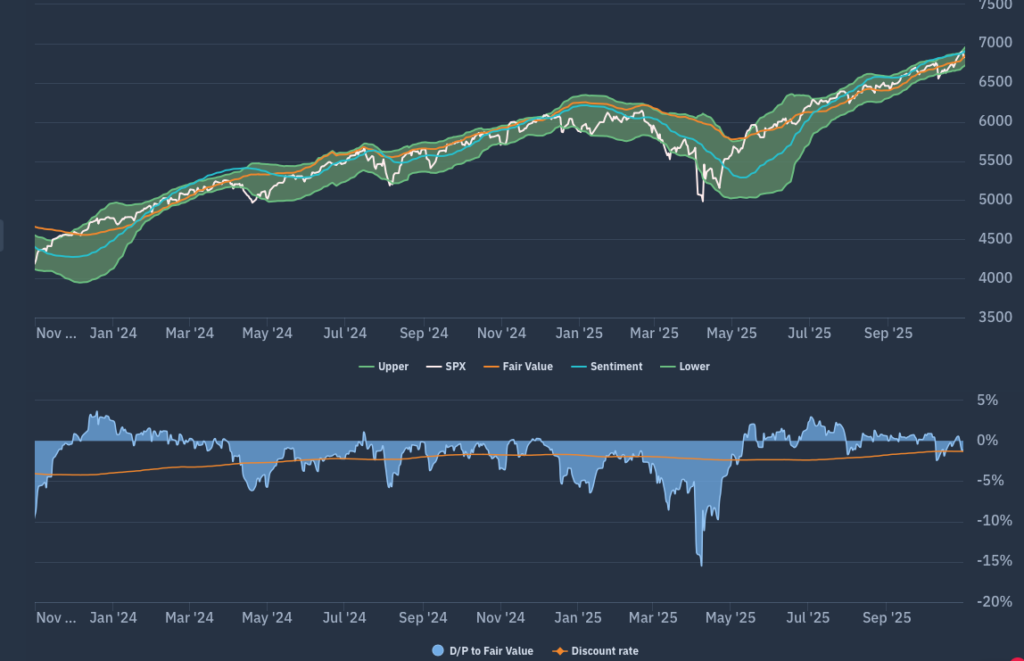
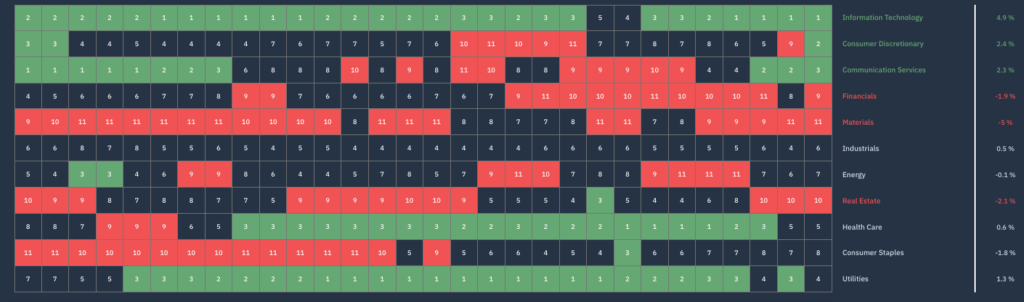
Chart 3 is another interesting counterpoint that we use. This is the Apollo beta heatmap for the S&P500 that shows the relative sector rankings in terms of rolling 1-month returns across the main US S&P500 market sectors, ranked by relative market beta from high beta (cyclical sectors) down to low Beta (defensive sectors). This highlights the persistent strength of the dominant Tech Sector, but also shows how Defensives have gained support and flow recently; suggesting that the market is less Beta biased/concentrated than in the recent past. Arguably this reflects the inevitability of more stock specific price responses as a result of the Q3 reporting season overriding more sector based flows or investment strategies and so it will be interesting to see how the overall net bias of the market (cyclical vs Defensive) shifts over the coming weeks.
Conclusions
We entered Q4 with a sense of equity markets “needing to deliver” and that there were likely to be stormier waters ahead as US companies – and the Mag 7 in particular – sought to do so in the Q3 reporting period. Risk management remained our watchword at the start of October – and to a large extent remains so now. Having run the regular rebalancing of all our Smart Alpha strategies mid-month, we are hopefully set to take advantage of the shift away from the blustery noise and volatility of the last few weeks and to be supported by the improving tail winds of sentiment that follow. Our rebalance back to “factor sub-portfolio neutral” weightings every two months means that we do not take explicit directional factor bets in our strategies, but as a point of interest, we will be watching to see if after a relatively underwhelming year, some of the growth stories now start to emerge as positive sentiment plays to be positioned ahead of 2026.
A final thought: It is interesting to see how many of the systematic Hedge Funds and investor trading firms have struggled to deal with market movements this year: the influence of surging retail flows in the US (particularly in the derivatives space) alongside the rapid emergence of relatively new investor asset classes such as Active ETFs appears to be providing some problems for their investment models. However, that has not prevented massive inflows into Hedge Funds overall – AUM is now over $5trn for the sector as larger institutions look to diversify more widely. Positive September and October equity market returns look to have been good for many Hedge Funds, but as inflows continue into the sector, accessing that AUM flow still requires credible performance to attract institutional interest. This suggests that, like retail, Hedge Funds are likely to remain engaged in the markets near term (i.e. into year-end) in order to show that they too, can deliver: Just another tail wind behind you.