
Storm season arrives

We call our regular Apollo based commentary “The Weather report”. The analogies that we can make with the multiple elements of Value, Momentum and Uncertainty impacting markets in a continuous way chimes nicely with the idea of Currents, Tides and Winds, all impacting the navigation of the high seas. Whatever the nature of the vessel concerned or the skills, experience and capabilities of the crew, the Maritime Weather Report is an essential part of the information system that is required and so the Market Weather Report is designed to perform a similar, essential function.
As the third quarter comes to an end, expectations of September being a poor performing month in the US market have been confounded by the best September since 2013.An interest rate cut by the Fed certainly helped sentiment and with the AI bandwagon continuing to roll, a (+8.5%) rally in the equal weighted Mag-7 ETF over the month shows how significant the potential AI story continues to be for sentiment.
As we move into the start of October and what is likely to be a crucial reporting season for the markets with the first glimpses of C-Suite expectations for 2026 starting to be revealed, it seems unlikely that the relative calm still being exhibited by the US market in particular (at 16.8, the VIX remains comfortably below the “low fear” threshold of 20 at time of writing) can persist. Certainly, the risk of either a sobering reality check or outright disappointment with respect to reports on actual AI revenues for the likes of MicroSoft and Open AI or a review of revenue growth on chip demand for NVIDIA or scalebacks on datacentre timelines from Oracle will feed into the rising levels of concern over the “AI bubble” that may be in place.
With the catch-up period of the late summer now firmly behind us and the 6-month figures taken from the end of March 2025 (and hence not yet a reflection of the post April recovery phase) dominated by the performance of the NASDAQ and essentially the Tech related selloff in January/February (that most people seem to have forgotten about), it is perhaps the year-to-date (YTD) figures that reveal the most to us about current market conditions.
Table 1: Performance Report
| Index/Strategy | 3m (%) | 6m (%) | YTD (%) | 1Y (%) |
| S&P 500 Index | 7.8 | 18.7 | 14.0 | 17.2 |
| S&P500 (Equal weight) | 4.4 | 9.4 | 8.7 | 6.5 |
| NASDAQ Index | 11.2 | 29.9 | 17.5 | 26.5 |
| S&P1200 Index (Global Developed Markets) | 7.5 | 18.3 | 17.2 | 16.7 |
| Smart Alpha US Large Cap Multi-Factor Strategy | 1.8 | 16.5 | 19.7 | 15.4 |
| Smart Alpha Global Large Cap Multi-Factor Strategy | 3.2 | 19.2 | 26.6 | 17.5 |
| Smart Alpha US Large Cap Value Strategy | 2.5 | 9.7 | 15.4 | 10.8 |
| Smart Alpha US Large Cap Growth Strategy | 2.6 | 16.5 | 13.6 | 9.0 |
| Smart Alpha US Mid/Large Cap Multi Factor | 3.0 | 24.0 | 21.7 | 19.2 |
| Smart Alpha US Mid/Large Cap Value Strategy | 3.8 | 20.5 | 23.2 | 19.8 |
Unlike its market cap weighted counterpart (+14%), the equal weight index has “only” grown by (+8.7%) YTD. This contrast highlights the market cap impact of the “Mag-7” on overall market performance and the dominance of the themes surrounding AI that have also driven the performance of the NASDAQ over a similar period up by (+17.5%). As we noted previously, as late as June 20th) the S&P500 was flat YTD with the (equal weighted Mag-7 universe flat right through to the end of the Q2. The (equal weighted) M7 stocks are now (+18%) over the course of 2025 – testimony to the
From a more global perspective, we can look at the performance of the S&P1200 developed market index (the S&P 500 plus 700 “other Developed market Large cap” stocks. This has a similar return outlook to that of the NASDAQ up (+17.2%) YTD in US$ terms – but running ahead of the S&P500 on the YTD measure as the (-7%) decline in the trade-weighted US$ YTD has boosted the returns of overseas stocks in US$ terms. The “weakness” of the US$ over the course of 2025 has been a factor behind an increasing interest to investors looking to try and “diversify away from (but not by too much) US concentrated exposure in Equities with the benefit of retaining developed market levels of liquidity, governance and compliance. However, we should not over think this: on a 1-year basis, the trade-weighted US$ is essentially flat – something that the 1-year returns also reflects.
“Smarts” from Smart Alpha
As is normal for the Weather report, we build out on these headline observations using a selection of the Smart Alpha strategies that we run (and publish – see https://www.libra-is.com/strategies ) to capture some of the underlying risk dynamics that appear to be at play. We construct these portfolios to help us access the best (risk-adjusted) excess returns that are available from the markets on an ongoing basis but, in doing so we are also able to gain a degree of insight as to what might be “working” at any point in time that can help shape expectations for the coming investment period.
With the Libra Smart Alpha strategies, we categorise all the stocks under coverage by “style factor” based upon our own, fundamentally derived classifications (Value, Growth, Quality, Junk etc.) using the Apollo model for expected returns. We then construct concentrated (48-stock), equal-weight, factor-based portfolios selected from the relevant underlying universes (S&P500, S&P1200 etc.) to reflect the “best” performing elements of those universes and generate excess returns.
What we can see from those portfolios (see Table 1) is that (on an equal weighted basis) the YTD US mid and large cap (+23.2%) and US large cap value (+15.4%) have both had a credible performance but when the difference in the portfolios is mostly related to relative size, it does point to a strong recovery in mid-Cap value stocks over the course of the year as a whole and particularly over the last six months. This tends to reinforce the view that a recovery in mid cap value stocks that followed the April 2025 sell-off has continued alongside the more recent summer rally in mega caps – a point we have noted upon in prior reports. Much of this can be related to the resilience of the emerging technology stories (not just AI) coming through in the US but also there is a degree of geopolitics here too, with the concerns over US tariffs that prompted the April moves providing the opportunity for excess returns over the following period. We will need to monitor this for the fourth quarter as these elements dissipate.
Returning to observations that we can make at a global level, the top line and factor performances of the Global S&P1200 strategy provide insight. The benchmark (which includes the S&P500 stocks but adds in 700 other large Cap stocks) had recovered its YTD returns back to positive territory by the start of May and stands at (+26.6%) YTD in US$ terms. Allowing for the aforementioned FX impact the relative outperformance remains an underpinning narrative for the recommendation of further diversification away from US-only exposure in equities.
Table 2: Global Factors
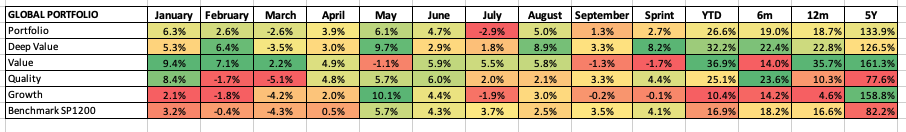
Returns by Factor
We are big advocates of this particular global strategy. In terms of the sector drivers that we can see in Table 2, the major impact on our Global Multi–factor portfolio from the sub-portfolios that we build as part of the process has been a big factor bias towards Value (+36.9%) vs Growth (+10.4%) on the YTD measure. As a reminder, when we construct a Smart Alpha portfolio, we not only rank stocks based on our risk adjusted expected returns, but by investment factor category. This is a crucial part of the risk management process embedded within our portfolio construction. At each rebalance we construct a 48-stock equal weighted portfolio with equal investment factor exposures to the factor(s) concerned. For example, we can construct a simple “Quality portfolio” by selection from stocks that Apollo categorises as Quality or a “Value portfolio” with equal exposures to Value and Deep Value stocks. We can also construct a factor neutral portfolio ( the one shown here and in table 1) with equal exposures to Deep Value, Value, Quality and Growth ( with zero exposure to Junk or other high risk categories) This ensures that there is no unintended or persistent factor bias embedded in the portfolios.
Digging into this further, the monthly data shows that the outperformance of Value was NOT just because of the sell -off/recovery after April but because of the Value outperformance in January and February that simply saw returns compounding to the sub portfolio throughout the following period. What is also worth noting is how, in February, May and August and again in September, the Deep Value sub- portfolio has had strong monthly outperformances, leaving it, YTD as the second strongest contributor to overall returns. Interestingly, Quality – often the by-word for growth at a reasonable price has remained something of a bystander for global returns over not only 2025, but in terms of longer-term returns, appears to have become far less of a source of excess return too.
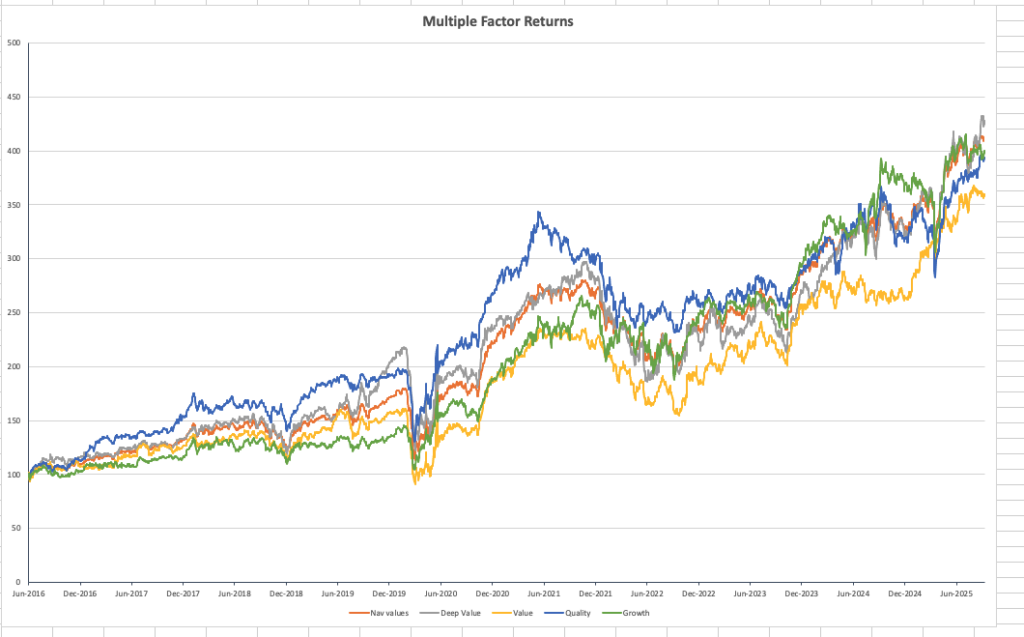
The longer-term compounding portfolio and sub portfolio NAV chart shown in Chart 1 illustrate this. Partly because of the disruptions in 2020, the 5-year return numbers can be a little misleading. Deep Value (grey) performance remains the lead sub portfolio – helped to a large extent by dramatic outperformances in both May and August this year. Quality – the dominant (blue line) from 2016 onwards remains aligned with both the total portfolio (orange) and clearly ahead of value (yellow) over the total period despite “only” matching the benchmark on the 5-year return measure and being only 2/3rd the return to Value in 2025 YTD shown in Table 2. Note too, that as Quality, Deep Value and Growth all took a hit in April 2025 before bouncing back strongly Quality, had experienced a poor February and March; suggesting that the declining sentiment towards the Global Tech sector in general that started to emerge in Q1 was impacting relatively early on Quality names too.
Chart 1: Compounding returns
Preparing for the storms
Summer and the run into quarter end has been a combination of catch-up and consolidation for equity markets. Optimism relating to AI has been able to persist – despite a few nervous headlines – and a cut in US interest rates by the Fed has allowed the “risk on” narrative to persist into the start of October.
We had wondered whether September’s history of being the poorest month in performance terms in US markets was set to be repeated, but it would seem that moves by the Fed and the continued strength and confidence in the Mag 7 stocks was enough to allow global markets to head higher into Quarter end, However, there may be relatively little respite. The run into the Q3 Reporting season in early October is now upon us has a reputation for higher-than-normal levels of market volatility as we get not only an update on year to date performances but an all-important first look at C-Suite thoughts for the (calendar) year ahead. Stock selections based upon intangible valuations are particularly prone to over reaction in such periods and there is clearly a wider sense relating to AI related narratives in particular, that delivery – not just ambition – is now the focus.
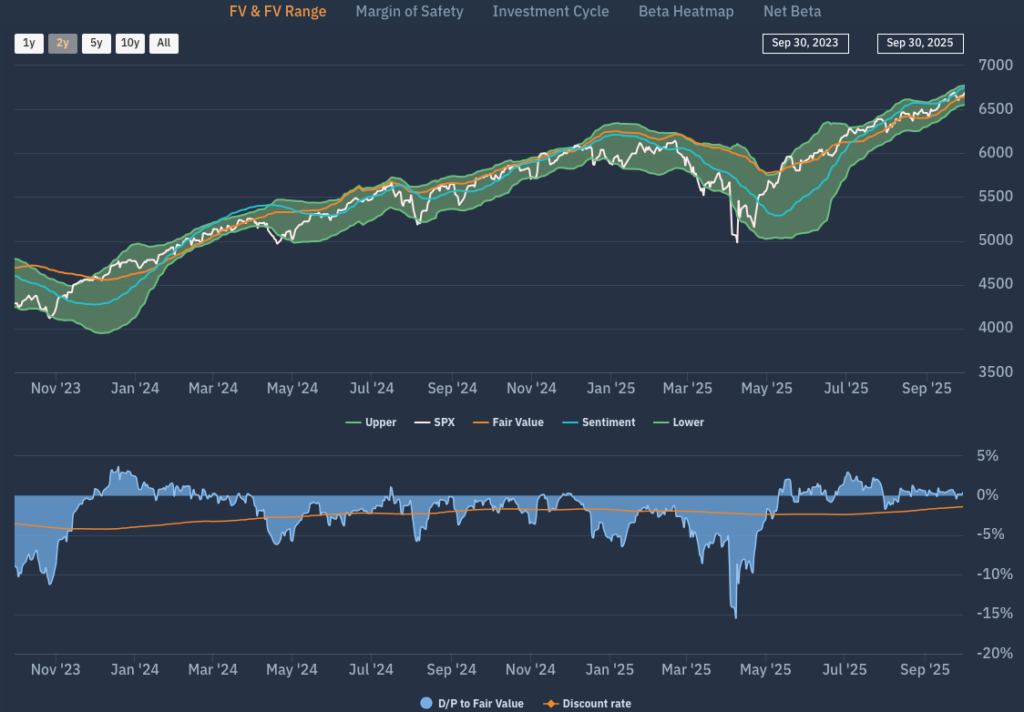
This may well lead to rising levels of uncertainty at the stock level but, at this point ,doesn’t make us fear for a wider, dramatic correction. Despite the news headlines and the apparent “drama” of Government shutdowns or rising political tensions, we mostly see markets continue to operate under extended periods of consolidation after truly dramatic market events such as April’s sell off, As Chart 2 shows, the outlook for the S&P500 through the eyes of the Apollo system is one where the Apollo measure of FV (orange line) is now trending higher once again, with the Apollo measure of sentiment (blue line) also strengthening. The trading range associated with this – the FV range is not only trending upwards but has experienced a steady narrowing over the last two months as directional confidence in the market overall has persisted.
Chart 2: Apollo FV range for S&P500
Conclusion – Storms to be expected – as usual
As always, there are many observers who are calling for market pullbacks or retracements after the kind of performance we have seen YTD, but as we observe, the nature of the market extension is more nuanced than it might first seem. Seen through the eyes of Apollo, it will be events and announcements – largely on their own merits – that the market will be reacting to in the coming quarter – as opposed to evidence of buyers regret at the market level or an overreaction to misplaced optimism. To return to our maritime analogy, we are heading for some stormier weather – that is for sure – as the corporate “Winds” pick up, but the general pattern of the currents and tides of valuation and momentum remain clearly upward and do not appear, for now at least, to be too affected by them. For investors that means that there is work to do in terms of managing their portfolios and paying particular attention to changing risks at the stock level, but then that is only business as usual at the start of Q4.