

We call this regular Apollo based commentary “The Weather report”. The analogies that we can make with the multiple elements of Value, Momentum and Uncertainty impacting markets in a continuous way chimes nicely with the idea of Currents, Tides and Winds, all impacting the navigation of the high seas. Whatever the nature of the vessel concerned or the skills, experience and capabilities of the crew, the Maritime Weather Report is an essential part of the information system that is required and so the Market Weather Report is designed to perform a similar, essential function.
Last month’s report touched upon the idea that, after the dramas of early April, it was if we had just “…navigated around Cape Horn – from the Atlantic into the Pacific” and that “…(T)he new Ocean we had just entered and the conditions that we now face may not be that different from those we know and understand, but until we experience them first-hand, we will need to be very careful indeed to understand the kind of weather systems that await us.”
The Weather Forecast
The financial media love a big number and the break above 6000 on the S&P500 is the latest headline to drop. The usual subheadings -“…have you missed the rally?”, “…is it too late to join the rally?” , “…is Tech going higher?” have followed as the beginning of the summer season leads to the usual rounds of market forecasts and predictions – almost as if nothing unusual had occurred in the financial markets since the start of April.
So, will the start of summer coincide with the traditional descaling of risk and decline in volumes as investors down tools and drift off to the beach? Unlikely we would suggest. After the last two years of 20%+ plus returns in US Equities (still the mainstay of most long only equity portfolios despite concerns over concentration risk in the US versus the rest of the world), the first half of the year is shaping up to be a tough call for those thinking about taking a profit and heading for the coast. At time of writing, the market “benchmark” the S&P500 is basically flat since Donald Trump won the US election. Although the 20% rally from April’s lows has grabbed the headlines (the “What was that all about?” moment we have discussed previously), most investors will recognise that this was, at best, a reversal of the oversell – it wasn’t a source of excess investment returns for anything but the most opportunist (lucky?) traders and investors. Moreover, the benchmark is not only flat since November 5th but flat over the last six months and flat since the start of 2025. Many might consider that a result after the April turmoil, but as we discussed in the last weather report, much of the market’s structural losses will have occurred in the first quarter as the “Mag-7” bubble deflated from its December 2024 highs. Returns are flat not just because of April’s post Liberation Day rout, but because the outlook for equity market returns has fundamentally changed since the end of 2024.
Beta blockers
Although it might not have felt like it as the post-US General Election rally took the Nasdaq up 12% and the S&P500 up 5% over the subsequent six weeks, the NASDAQ 100 and S&P500 essentially peaked in mid-December and, after a second attempted rally in February, staged a steady decline into quarter end before being caught up in the early April collapse.
Perhaps the question to ask here is not what does the pattern of the S&P500’s realised return profile look like over the last year (even though it’s up less than +2% YTD it’s still up over (+11%) on a 12-month basis) but what the underlying outlook for returns actually looked like both in the run up to – and subsequently after – the mid December 2024 peak. The two charts below are from the Libra Apollo valuation model and show the underlying structure of the S&P500 index (the NASDAQ 100 index actually looks very similar to this). For more details on the background and methodology underpinning Apollo, follow the link here.
Because of the systematic, Bottom Up (BU) nature of the Apollo process, if we know the Fair Value or Intrinsic value of every stock within the S&P500 at any point in time, then we can create a coincident time series value for the index itself. (This is true for any Index, basket, or Portfolio of stocks but the focus here is on the “benchmark”.) The Blue line in the first chart is a time series Intrinsic Value of the S&P500 Index according to Apollo and what we can see is that the slope of that line historically gives a pretty clear guide to the market’s Beta (expected return). The fact that the Intrinsic value trend has rolled over (and is now negative) since April 2025 is not a surprise, but in truth, the trend line since last November had already flattened considerably. The good news is that whilst recognising that the recent value trend has now turned negative, that underlying trend is still not significantly so. A broadly flat trend would point to an Intrinsic value by November 2025 on a level not dissimilar to the November 2024 level and close to the current level shown on the chart. The bad news, of course is that it suggests that rallies (above the trend value line) are more likely to be sold than chased as uncertainty persists into the summer. The directional “Beta” of this market has essentially flatlined – we are “Beta-blocked”.
The other lines shown (put zero and call zero) on the top chart represent the boundaries of the Apollo derived Margin of Safety calculation. This uses an implied volatility methodology to determine the extent of uncertainty that exists at any point with respect to value. The idea is that by pricing the cost of a (free) put and a (free) call option based upon a strike price of (current) Intrinsic value, the boundaries of the probability distribution of the risk premium can be quantified. The lower chart (labelled as the Value Indicator) then tracks the share price with respect to that (normalised) range. The green and red boundaries reflect the pareto 80/20 guidelines for this range and help to identify the degree of overbought or oversold with respect to value. The chart nicely illustrates how extreme the sell-off in 2020 was – it is the only point at which the lower zero% boundary was broken but also the way in which the persistent bear market in H1 2022 saw the 20% boundary eventually breached before staging a 12% rally back to Intrinsic value (and to just below the 50% mark on the Value Indicator) by August 2022. This clearly maps to the recent market performance since April 2025 and perhaps suggests the market might have a difficult time sustaining the Q2 rally much further until we see a clear improvement in the valuation trend.
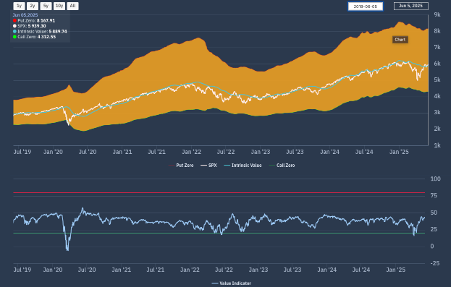
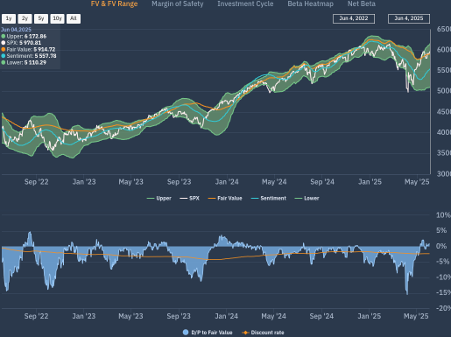
Chart 2 only goes back three years (so not as far as March 2020) but shows a shorter-term trading framework that we also use known as the FV range. This is a volatility-based framework that sets a probability range for price activity where a boundary break highlights a shift in sentiment conditions and risk appetite. The blue line on this chart is a (directional) sentiment indicator of the market risk appetite. There are lots of insights that we are able to derive from this kind of chart but in the context of the current discussion we would highlight the following:
The width of the range (the green zone) serves as a good indicator of market confidence/degree of certainty for the “shorter-term end” of the market with respect to the asset being studied. Where the market has a high degree of confidence in the future trend outlook for the asset price (positive or negative) the range will narrow considerably ( Q1 2024 being a good example) whilst periods of increasing uncertainty see the range widening. -as we see from mid-December 2024 in the chart below.
The next thing to note is the chart shows the market breaking down through its lower boundary on 18th December 2024 following a period of time where the sentiment indicator had flatlined. Note too, that the width of the range has been steadily widening ever since that point and so the lower boundary breach on March 6th – a month before Liberation Day was an indicator of a significant deterioration in market confidence.
The final point to note is how the breakout to the upside on May 12th marked the low point for the sentiment trend as the index price finally broke up to trade at a premium to the Fair Value of the index. This is actually not a particularly common occurrence – as we can see on the lower chart which shows the discount/premium to FV. Q1 2024 was the last period during which this happened suggesting that this recent upside momentum may be running out of steam.
Prospects for the run to the holidays
Those who would have traditionally followed the mantra of “sell in May” were either stuck in the trap of having been long into the start of Q2 (with disappointing performance) and thus missed out on buying early in the rally from mid-April or, if they had chosen to lighten positions into quarter-end and avoided the worst of the sell-down, would be reluctant to treat the last month or so’s performance as a simple trade. Having either held onto positions throughout April and May or having added or entered into new positions more recently, the idea of profit taking here will only be an option for relatively few investors. This is slightly different to the experience of H1 2024 which had seen (an equal weighted) M7 rise of 17% in Q1 and 15% in Q2 as Nvidia in particular took off. The “AI narrative for investment” had kicked in hard and it was only the short, sharp August sell-off that put a halt to the multi-year positive trend that can be seen on Chart 1. In fact ,both charts highlight the persistence of that underlying trend (Beta) throughout 2024 that was the source of much of the returns available.
What we now see is that “beta is blocked”. Beta is no longer going to carry investors into the summer with positive momentum or allow them to take profits on a recent rally. In the “Current’s Tides and Winds” parlance of the Weather Forecast, Beta is the Current underpinning the direction of the seas and our entrance into a “New Ocean” reveals the need to use more than just the Current to make progress. The need to also harness the Wind and the Tides available is the reminder here. As a point of comparison, the following chart shows how the Smart Alpha portfolio sourced from the S&P 500 performed over the recent (YTD) period. This portfolio is a 48-stock equal weight portfolio that rebalances every other month (it can be followed live here).
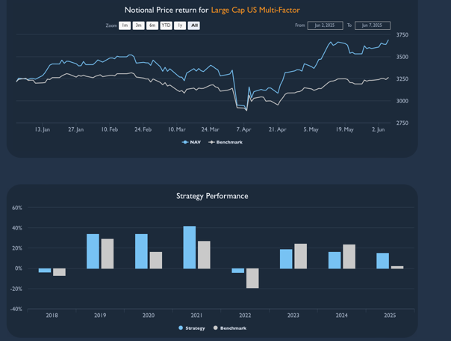
*Large Cap US Multi-Factor – is a 48-stock equal weighted equity portfolio, designed to provide a style factor risk-neutral portfolio, using Libra’s proprietary Smart Alpha stock selection and factor risk models and the portfolio’s holdings are systematically identified and selected from the current S&P500® universe. Smart Alpha’s systematic rebalancing approach means that the portfolio is reviewed and updated every two months, ensuring that both the risk profile and expected return of the portfolio are maintained in line with the strategy objectives of sustainable compound returns. *Benchmark used is the S&P 500®
This demonstrates that, unlike the benchmark, the strategy remained in the green throughout the first quarter. And, although it did suffer alongside everything else in early April, its recovery and acceleration into May has left it up 15% YTD (against the benchmark +2%). Does this mean that it’s time to down tools for this approach? No. It simply shows that this portfolio was able to sail through the recent storms by using all three of our nautical components. It took active advantage of what (Current) beta was available but added in active positive alpha (Tides) returns from Value opportunities at the start of the year and more latterly the recovering risk appetite (Winds) towards growth. As we discussed last month, we may be moving towards “.. A new Era – not Passive, not Active but, perhaps, “Pro-Active” investment? The story of the summer will be that if you had been able to set your sails correctly, the drawdown into – and recovery back from – April would have allowed a your portfolio to “sail away” in May and into June, with the portfolio balance of Expected Return and risk ready to be reviewed in a week or so from now (we will be rebalancing all of our portfolios again next week). That’s the time to set things up for summer.